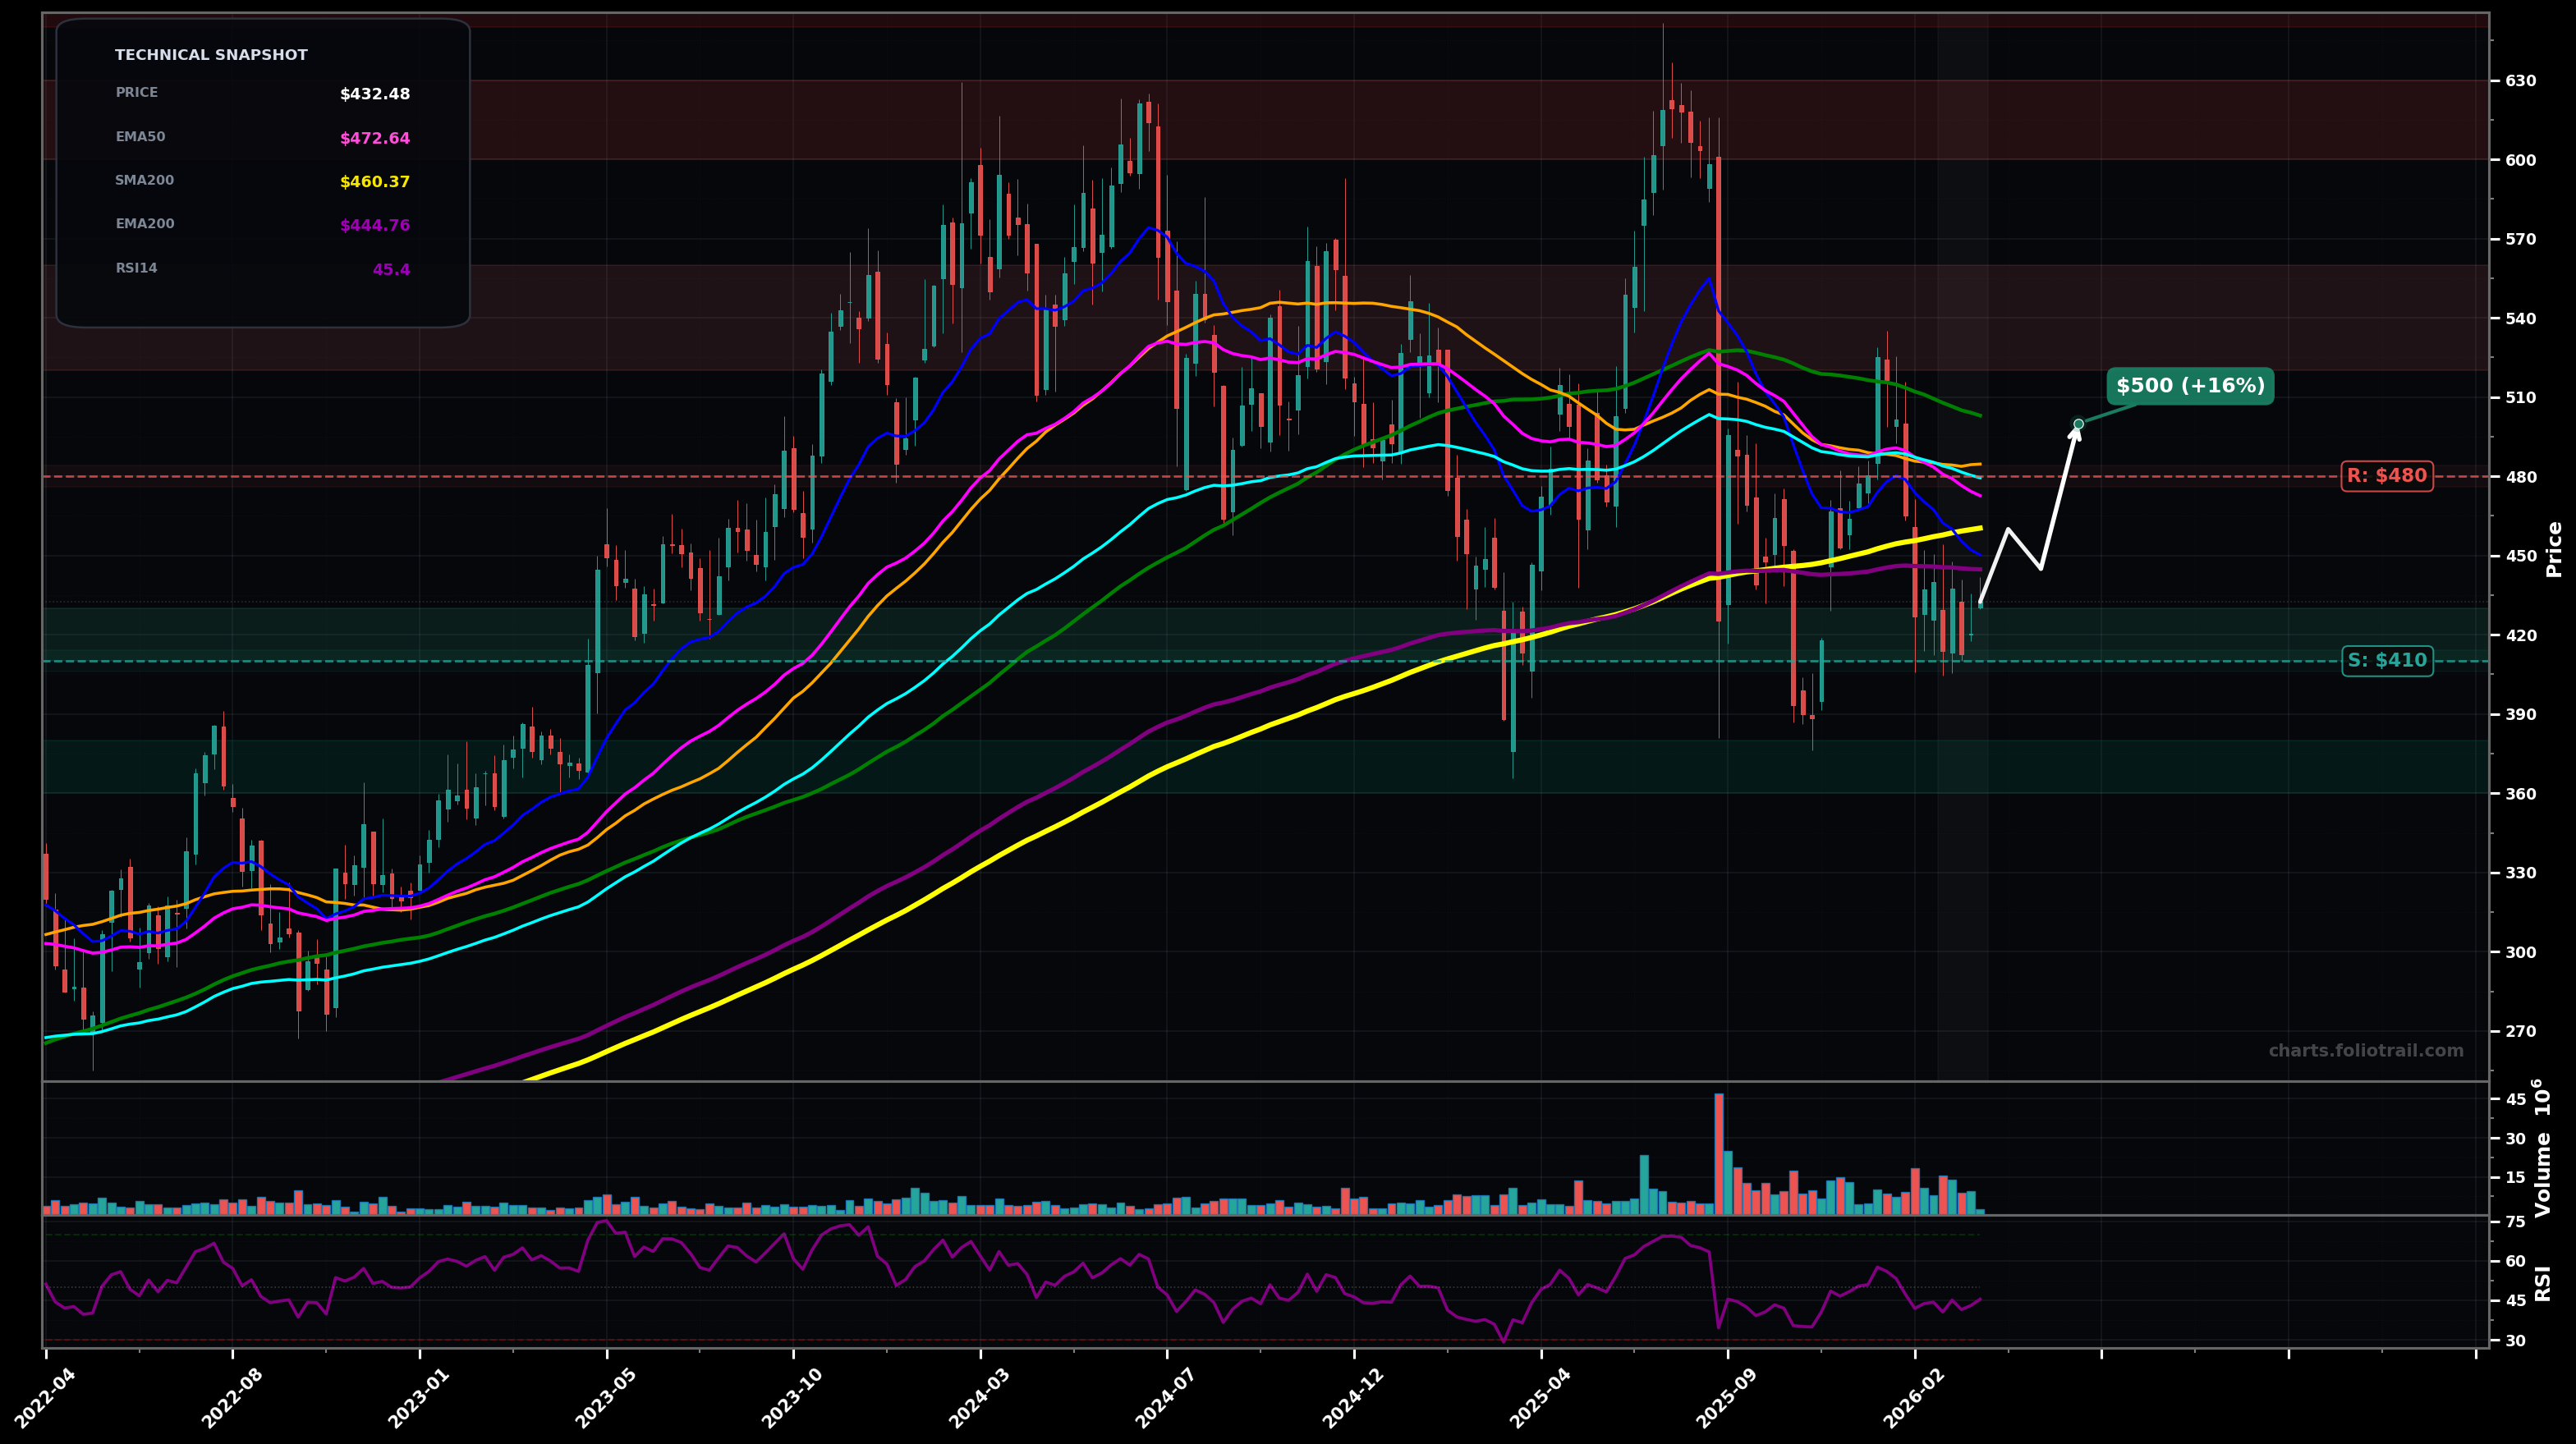
As of March 24, 2026, SNPS (Synopsys, Inc.) is in a choppy range state on the weekly chart, with a confidence level of 64%. Key support is at $410 and key resistance at $480. Weekly price is ~$432.48, rebounding off the ~$410-$420 demand zone but still trading below the clustered EMA50/EMA100 and below the $460 SMA200; RSI ~45 suggests weak/neutral momentum.
Range continuation: price grinds higher from EMA200 area and retests the moving-average ceiling; sellers likely defend the ~$470-$500 cluster (EMA50/EMA100 + SMA50/SMA100 overhead). Rough probability ~55%.
Bearish breakdown: loss of the recent swing-low reference near ~$410 triggers a fast move to the next demand pocket and prior base; this would also align with a likely Elliott Wave C/5-type flush from the larger topping structure. Rough probability ~45%.
CHOPPY_RANGE confirmed if price keeps closing between ~$410 and ~$480 for 3+ weekly closes.
CHOPPY_RANGE invalidated on a weekly close above ~$480 (reclaim EMA50/EMA100 zone) with follow-through, or a weekly close below ~$410 (range breakdown).
Start near range support ($410-$430); add on breakdown/retest ($390-$410); heavy add at next higher-timeframe demand and likely Fib retrace pocket (~$360-$380).
Trim into prior supply and likely wave (B)/(2) retrace zones ($520-$560), heavier trimming near the prior peak/supply ($600-$630), and close if price becomes stretched into new-extension territory ($650-$700).
As of March 24, 2026, SNPS (Synopsys, Inc.) is in a choppy range state on the weekly chart with 64% confidence. Weekly price is ~$432.48, rebounding off the ~$410-$420 demand zone but still trading below the clustered EMA50/EMA100 and below the $460 SMA200; RSI ~45 suggests weak/neutral momentum.
On the weekly timeframe, SNPS has key support at $410 and key resistance at $480. The most likely scenario (bullish) targets $460 and $500, with a revert level at $445.
SNPS (Synopsys, Inc.) is currently classified as choppy range on the weekly chart, with 64% confidence. Confirmation requires: CHOPPY_RANGE confirmed if price keeps closing between ~$410 and ~$480 for 3+ weekly closes. This would be invalidated by: CHOPPY_RANGE invalidated on a weekly close above ~$480 (reclaim EMA50/EMA100 zone) with follow-through, or a weekly close below ~$410 (range breakdown).
The most likely scenario (bullish) targets $460 and $500, with a revert level at $445. The alternative scenario (bearish) targets $390 and $360.
All content on this website — including charts, analysis, price targets, support/resistance levels, and position zones — is generated entirely by AI and provided for educational and informational purposes only.
This is not financial advice. NEXUSNOIR VENTURES SL (the operator of this website) is not a registered investment adviser or broker-dealer. You should not make investment decisions based solely on this information. Always do your own research and consult a qualified financial advisor.
By continuing, you acknowledge that you have read and agree to our full disclaimer & terms of use and privacy policy.