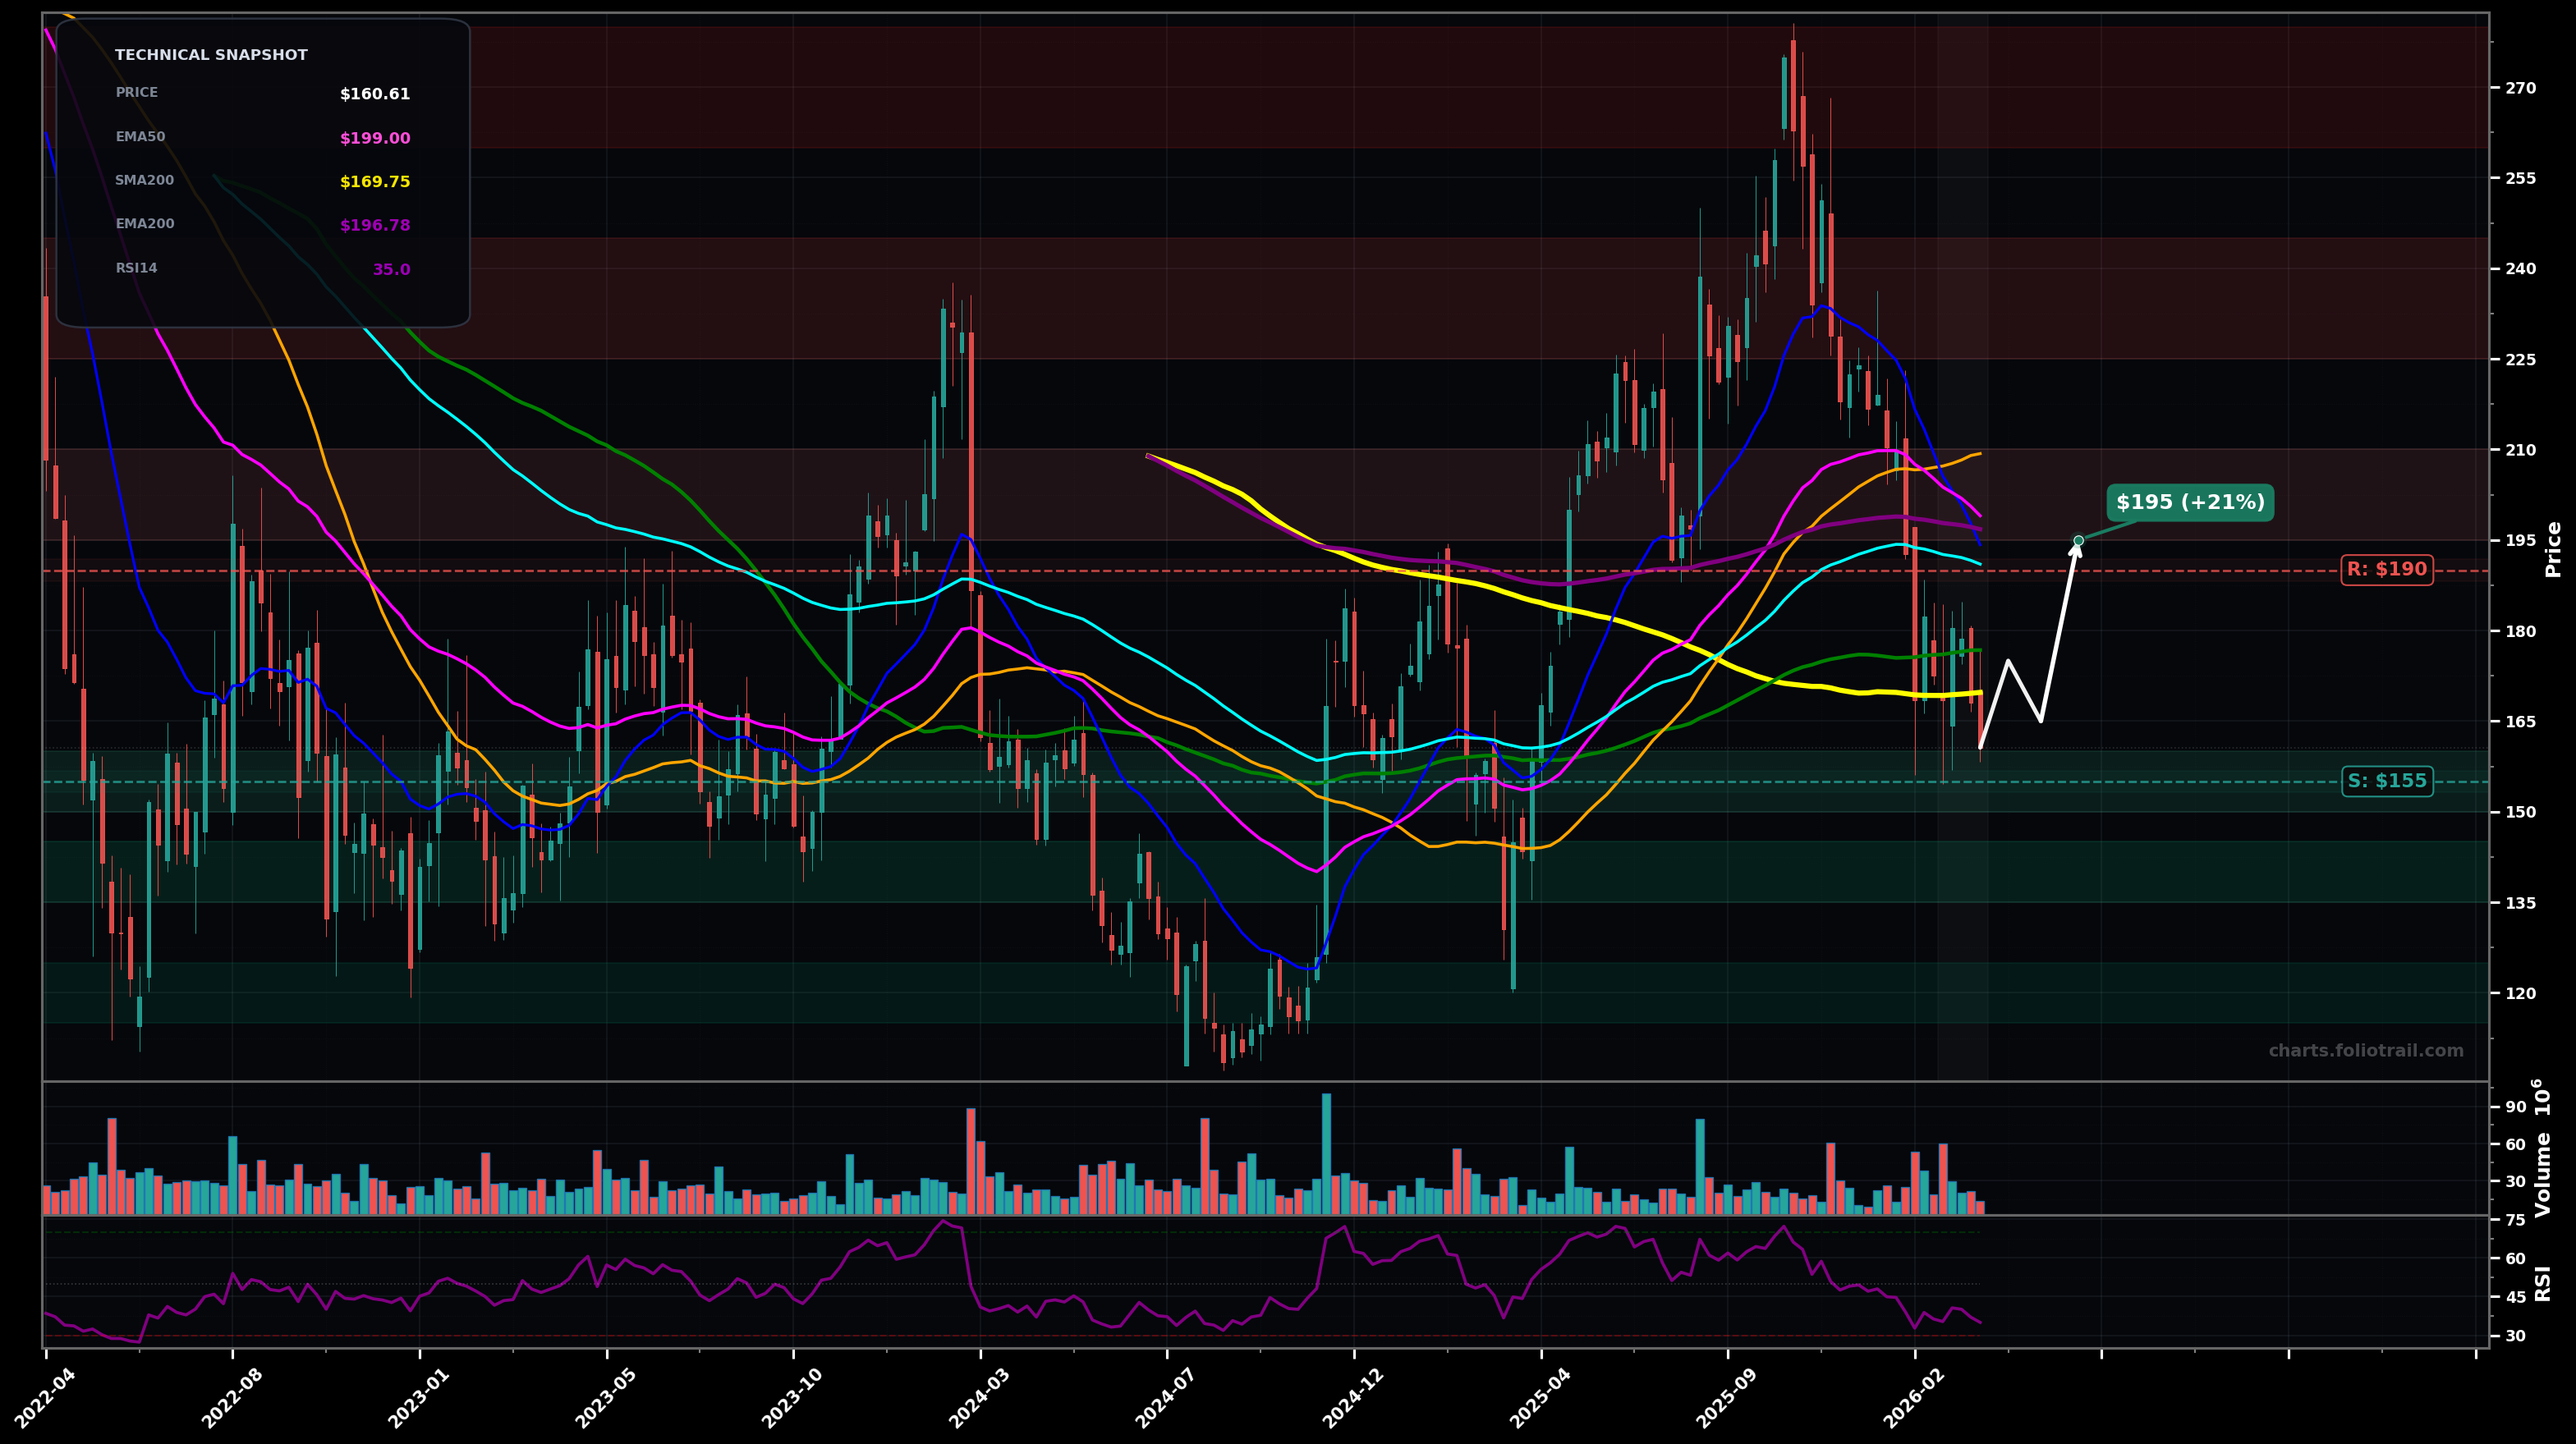
As of March 26, 2026, SNOW (Snowflake Inc.) is in a downtrend state on the weekly chart, with a confidence level of 72%. Key support is at $155 and key resistance at $190. Weekly selloff pushed price to ~$160.6, below EMA50/EMA100/EMA200 and under SMA200; momentum weak (RSI ~35) with recent lower highs from the ~$270 peak.
Base-building attempt: price defends the ~$155 weekly demand (prior pivot/undercut area), then mean-reverts into the MA cluster; expect choppy bounce rather than a clean V-reversal.
Trend continuation: lose ~$155 on a weekly close, triggering another impulsive leg lower (Elliott: extending wave (3)/(C) lower), with downside measured move toward prior consolidation and Fib retrace zones.
Weekly close below $155 confirms continuation lower (next leg down from the recent swing-low reference zone).
Weekly close back above $190 (reclaim EMA100/EMA200 zone) would invalidate the immediate downtrend pressure and favor a base/reversal attempt.
Scale-in around the $155 swing-low reference and prior demand; add if breakdown finds support at next weekly shelf; heavy add only near deeper prior-base/Fib-extension area if capitulation occurs.
Trim into the overhead MA supply ($195-$210) and prior distribution range ($225-$245); fully close near prior peak supply where the last impulsive selloff started ($260-$280).
As of March 26, 2026, SNOW (Snowflake Inc.) is in a downtrend state on the weekly chart with 72% confidence. Weekly selloff pushed price to ~$160.6, below EMA50/EMA100/EMA200 and under SMA200; momentum weak (RSI ~35) with recent lower highs from the ~$270 peak.
On the weekly timeframe, SNOW has key support at $155 and key resistance at $190. The most likely scenario (bullish) targets $175 and $195, with a revert level at $165.
SNOW (Snowflake Inc.) is currently classified as downtrend on the weekly chart, with 72% confidence. Confirmation requires: Weekly close below $155 confirms continuation lower (next leg down from the recent swing-low reference zone). This would be invalidated by: Weekly close back above $190 (reclaim EMA100/EMA200 zone) would invalidate the immediate downtrend pressure and favor a base/reversal attempt.
The most likely scenario (bullish) targets $175 and $195, with a revert level at $165. The alternative scenario (bearish) targets $140 and $120.
Multi-layer AI agents analyse 200+ stocks across daily, weekly, and monthly timeframes — producing market state classifications, price scenarios with targets, and position entry/exit levels. Updated every trading day after market close. No paywall. No sign-up required.
Built by Foliotrail.
All content on this website — including charts, analysis, price targets, support/resistance levels, and position zones — is generated entirely by AI and provided for educational and informational purposes only.
This is not financial advice. NEXUSNOIR VENTURES SL (the operator of this website) is not a registered investment adviser or broker-dealer. You should not make investment decisions based solely on this information. Always do your own research and consult a qualified financial advisor.
By continuing, you acknowledge that you have read and agree to our full disclaimer & terms of use and privacy policy.