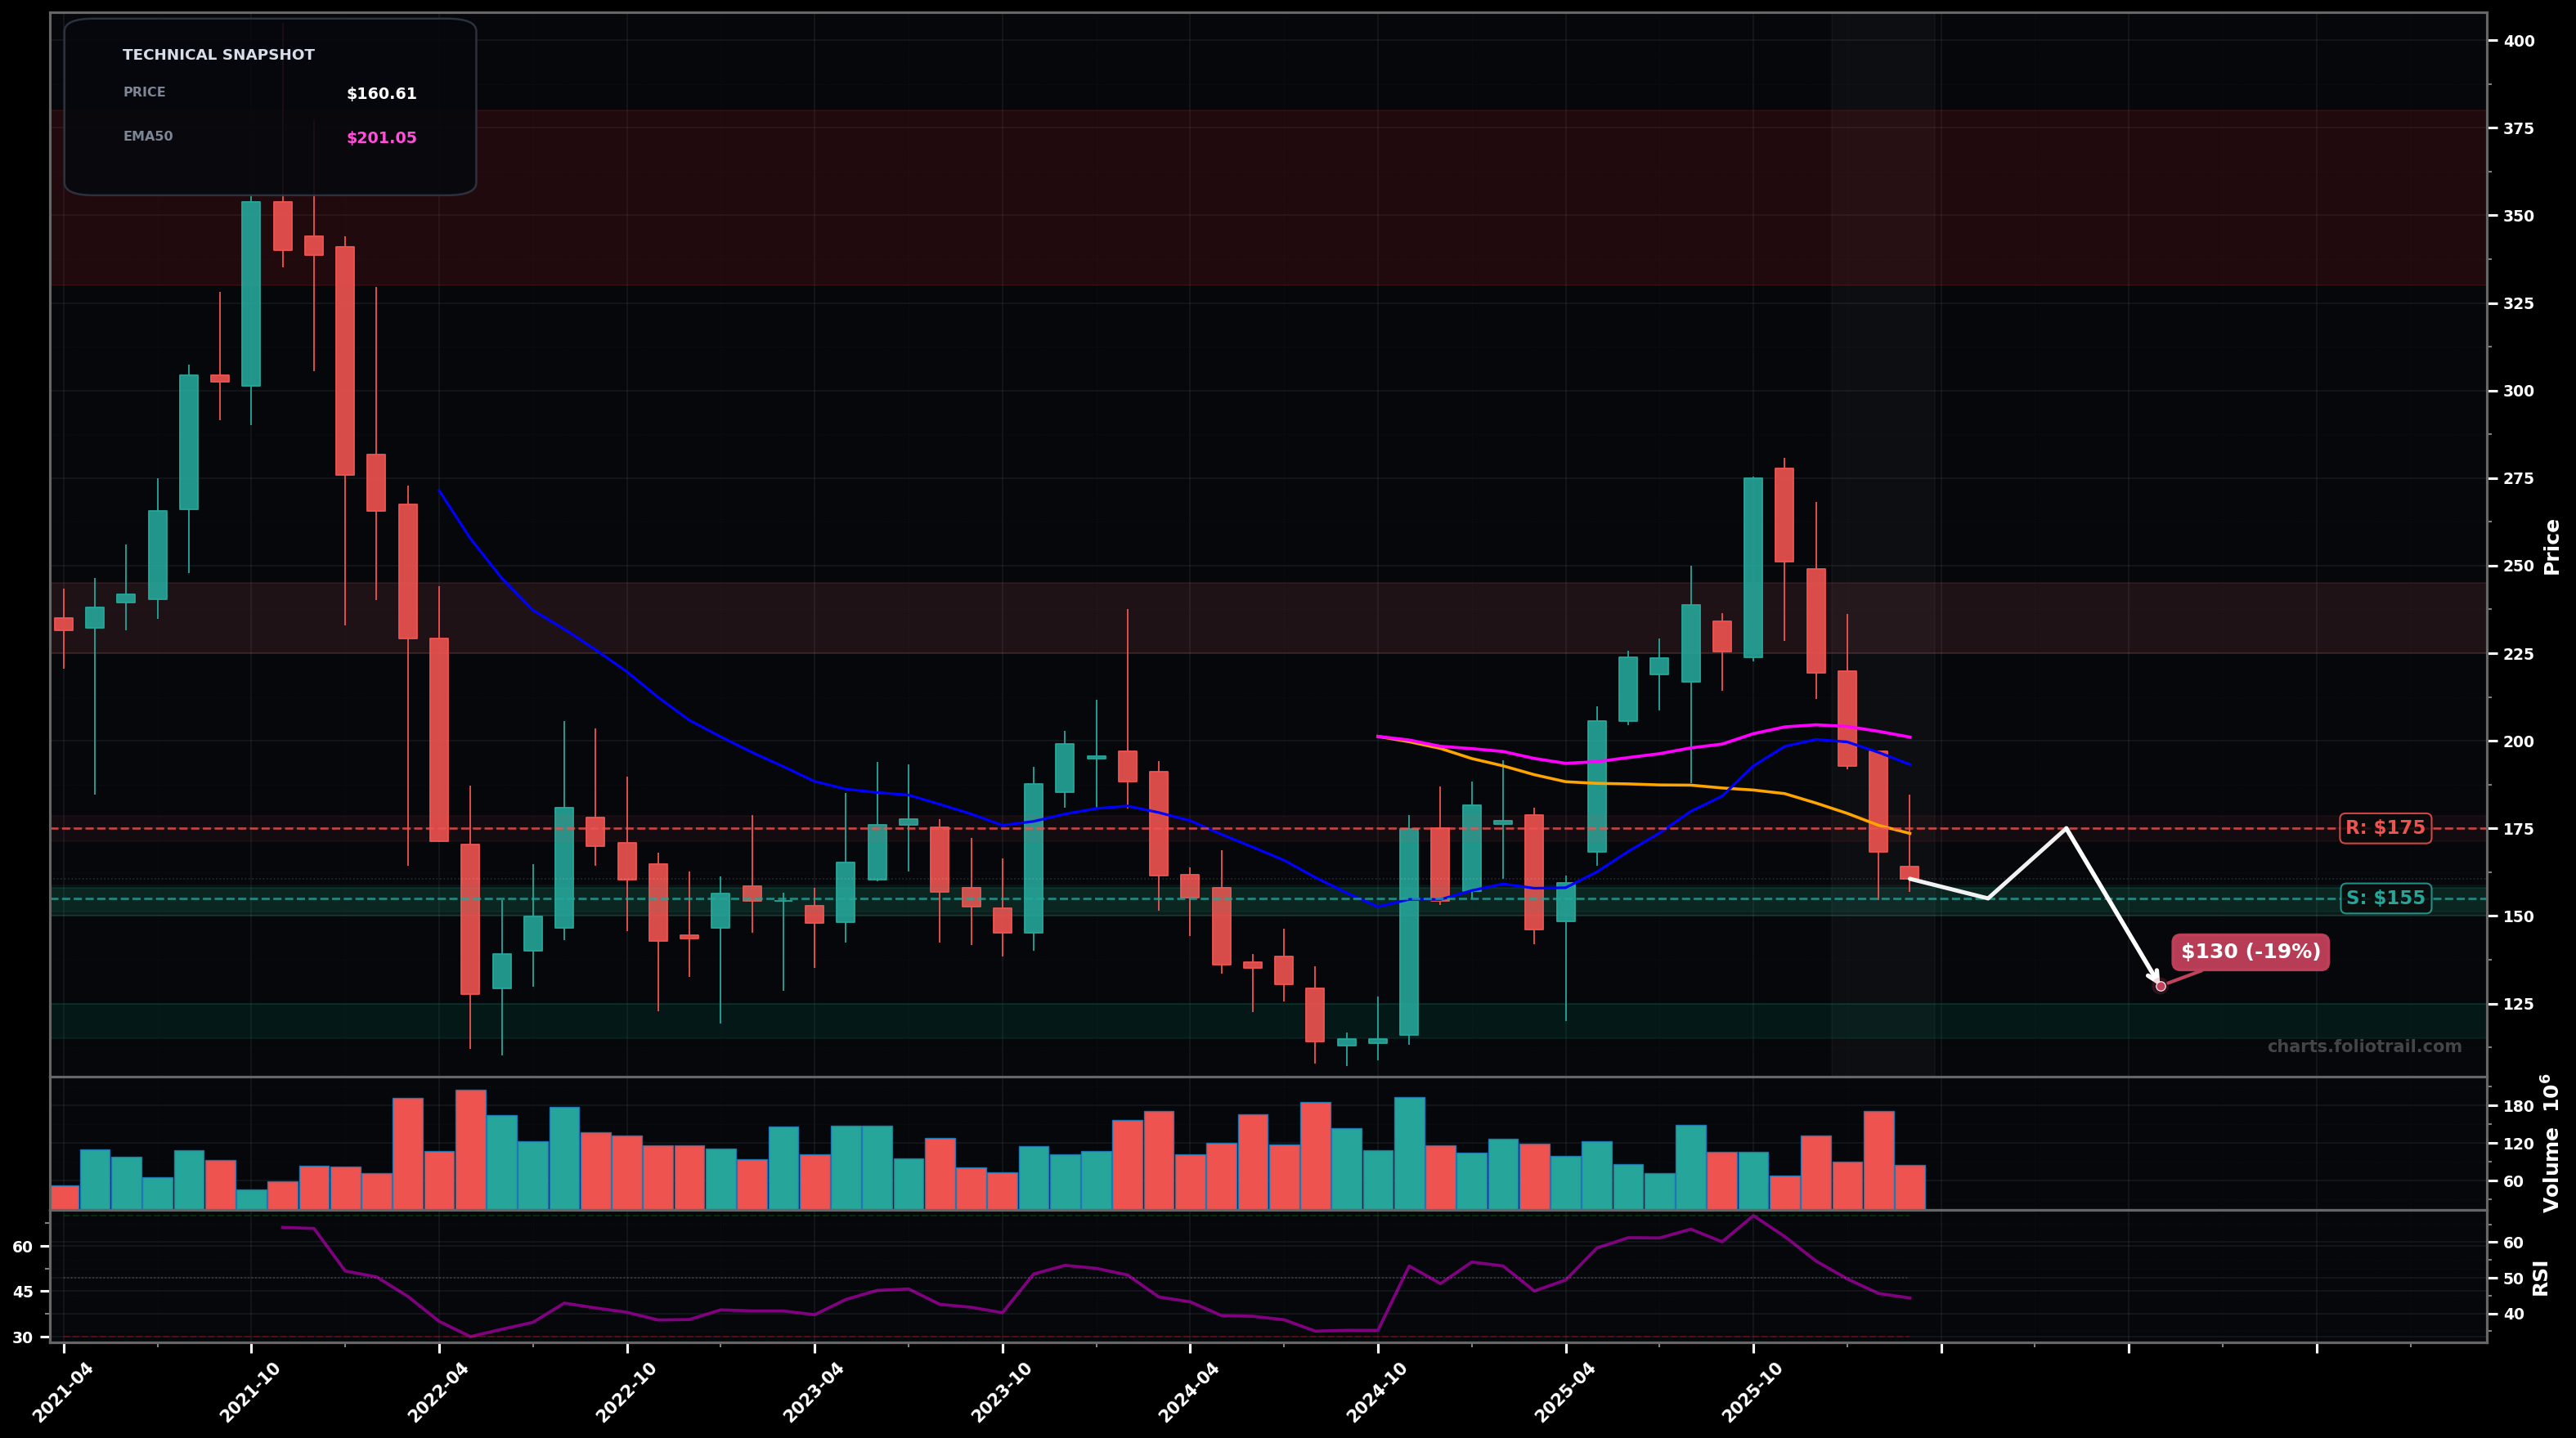
As of March 26, 2026, SNOW (Snowflake Inc.) is in a downtrend state on the monthly chart, with a confidence level of 72%. Key support is at $155 and key resistance at $175. Monthly selloff from the $270-$280 peak; last candles are red and price ($160.61) is below the $173.57 SMA50 and below the $193.25 EMA20 / $201.05 EMA50 with RSI14 ~44 (weak momentum).
Bearish continuation: a weak bounce stalls under $175-$193, then price grinds lower to retest $155 and potentially flush toward the prior base near $130.
Bottoming attempt: hold $155 and form a monthly HL; reclaim $175 then $193-$201 (EMA20/EMA50 cluster) to trigger a larger mean-reversion rally toward $225-$240 (prior breakdown zone / Fib retrace area).
Monthly close below $155 (breaks the current swing low support zone).
2+ monthly closes back above $201 (reclaim EMA50 area and hold).
Scale near the current swing-low support ($155) first; add at the prior monthly base/likely demand ($130s); heavy add only on a capitulation retest toward the 2024 low region (~$120) where larger-degree support should sit.
Trim into mean-reversion resistance and prior distribution zones ($230s then $280s); fully close if price returns to the upper multi-year supply area ($330-$380) where prior bull-leg exhaustion occurred.
As of March 26, 2026, SNOW (Snowflake Inc.) is in a downtrend state on the monthly chart with 72% confidence. Monthly selloff from the $270-$280 peak; last candles are red and price ($160.61) is below the $173.57 SMA50 and below the $193.25 EMA20 / $201.05 EMA50 with RSI14 ~44 (weak momentum).
On the monthly timeframe, SNOW has key support at $155 and key resistance at $175. The most likely scenario (bearish) targets $155 and $130, with a revert level at $175.
SNOW (Snowflake Inc.) is currently classified as downtrend on the monthly chart, with 72% confidence. Confirmation requires: Monthly close below $155 (breaks the current swing low support zone). This would be invalidated by: 2+ monthly closes back above $201 (reclaim EMA50 area and hold).
The most likely scenario (bearish) targets $155 and $130, with a revert level at $175. The alternative scenario (bullish) targets $193 and $230.
Multi-layer AI agents analyse 200+ stocks across daily, weekly, and monthly timeframes — producing market state classifications, price scenarios with targets, and position entry/exit levels. Updated every trading day after market close. No paywall. No sign-up required.
Built by Foliotrail.
All content on this website — including charts, analysis, price targets, support/resistance levels, and position zones — is generated entirely by AI and provided for educational and informational purposes only.
This is not financial advice. NEXUSNOIR VENTURES SL (the operator of this website) is not a registered investment adviser or broker-dealer. You should not make investment decisions based solely on this information. Always do your own research and consult a qualified financial advisor.
By continuing, you acknowledge that you have read and agree to our full disclaimer & terms of use and privacy policy.