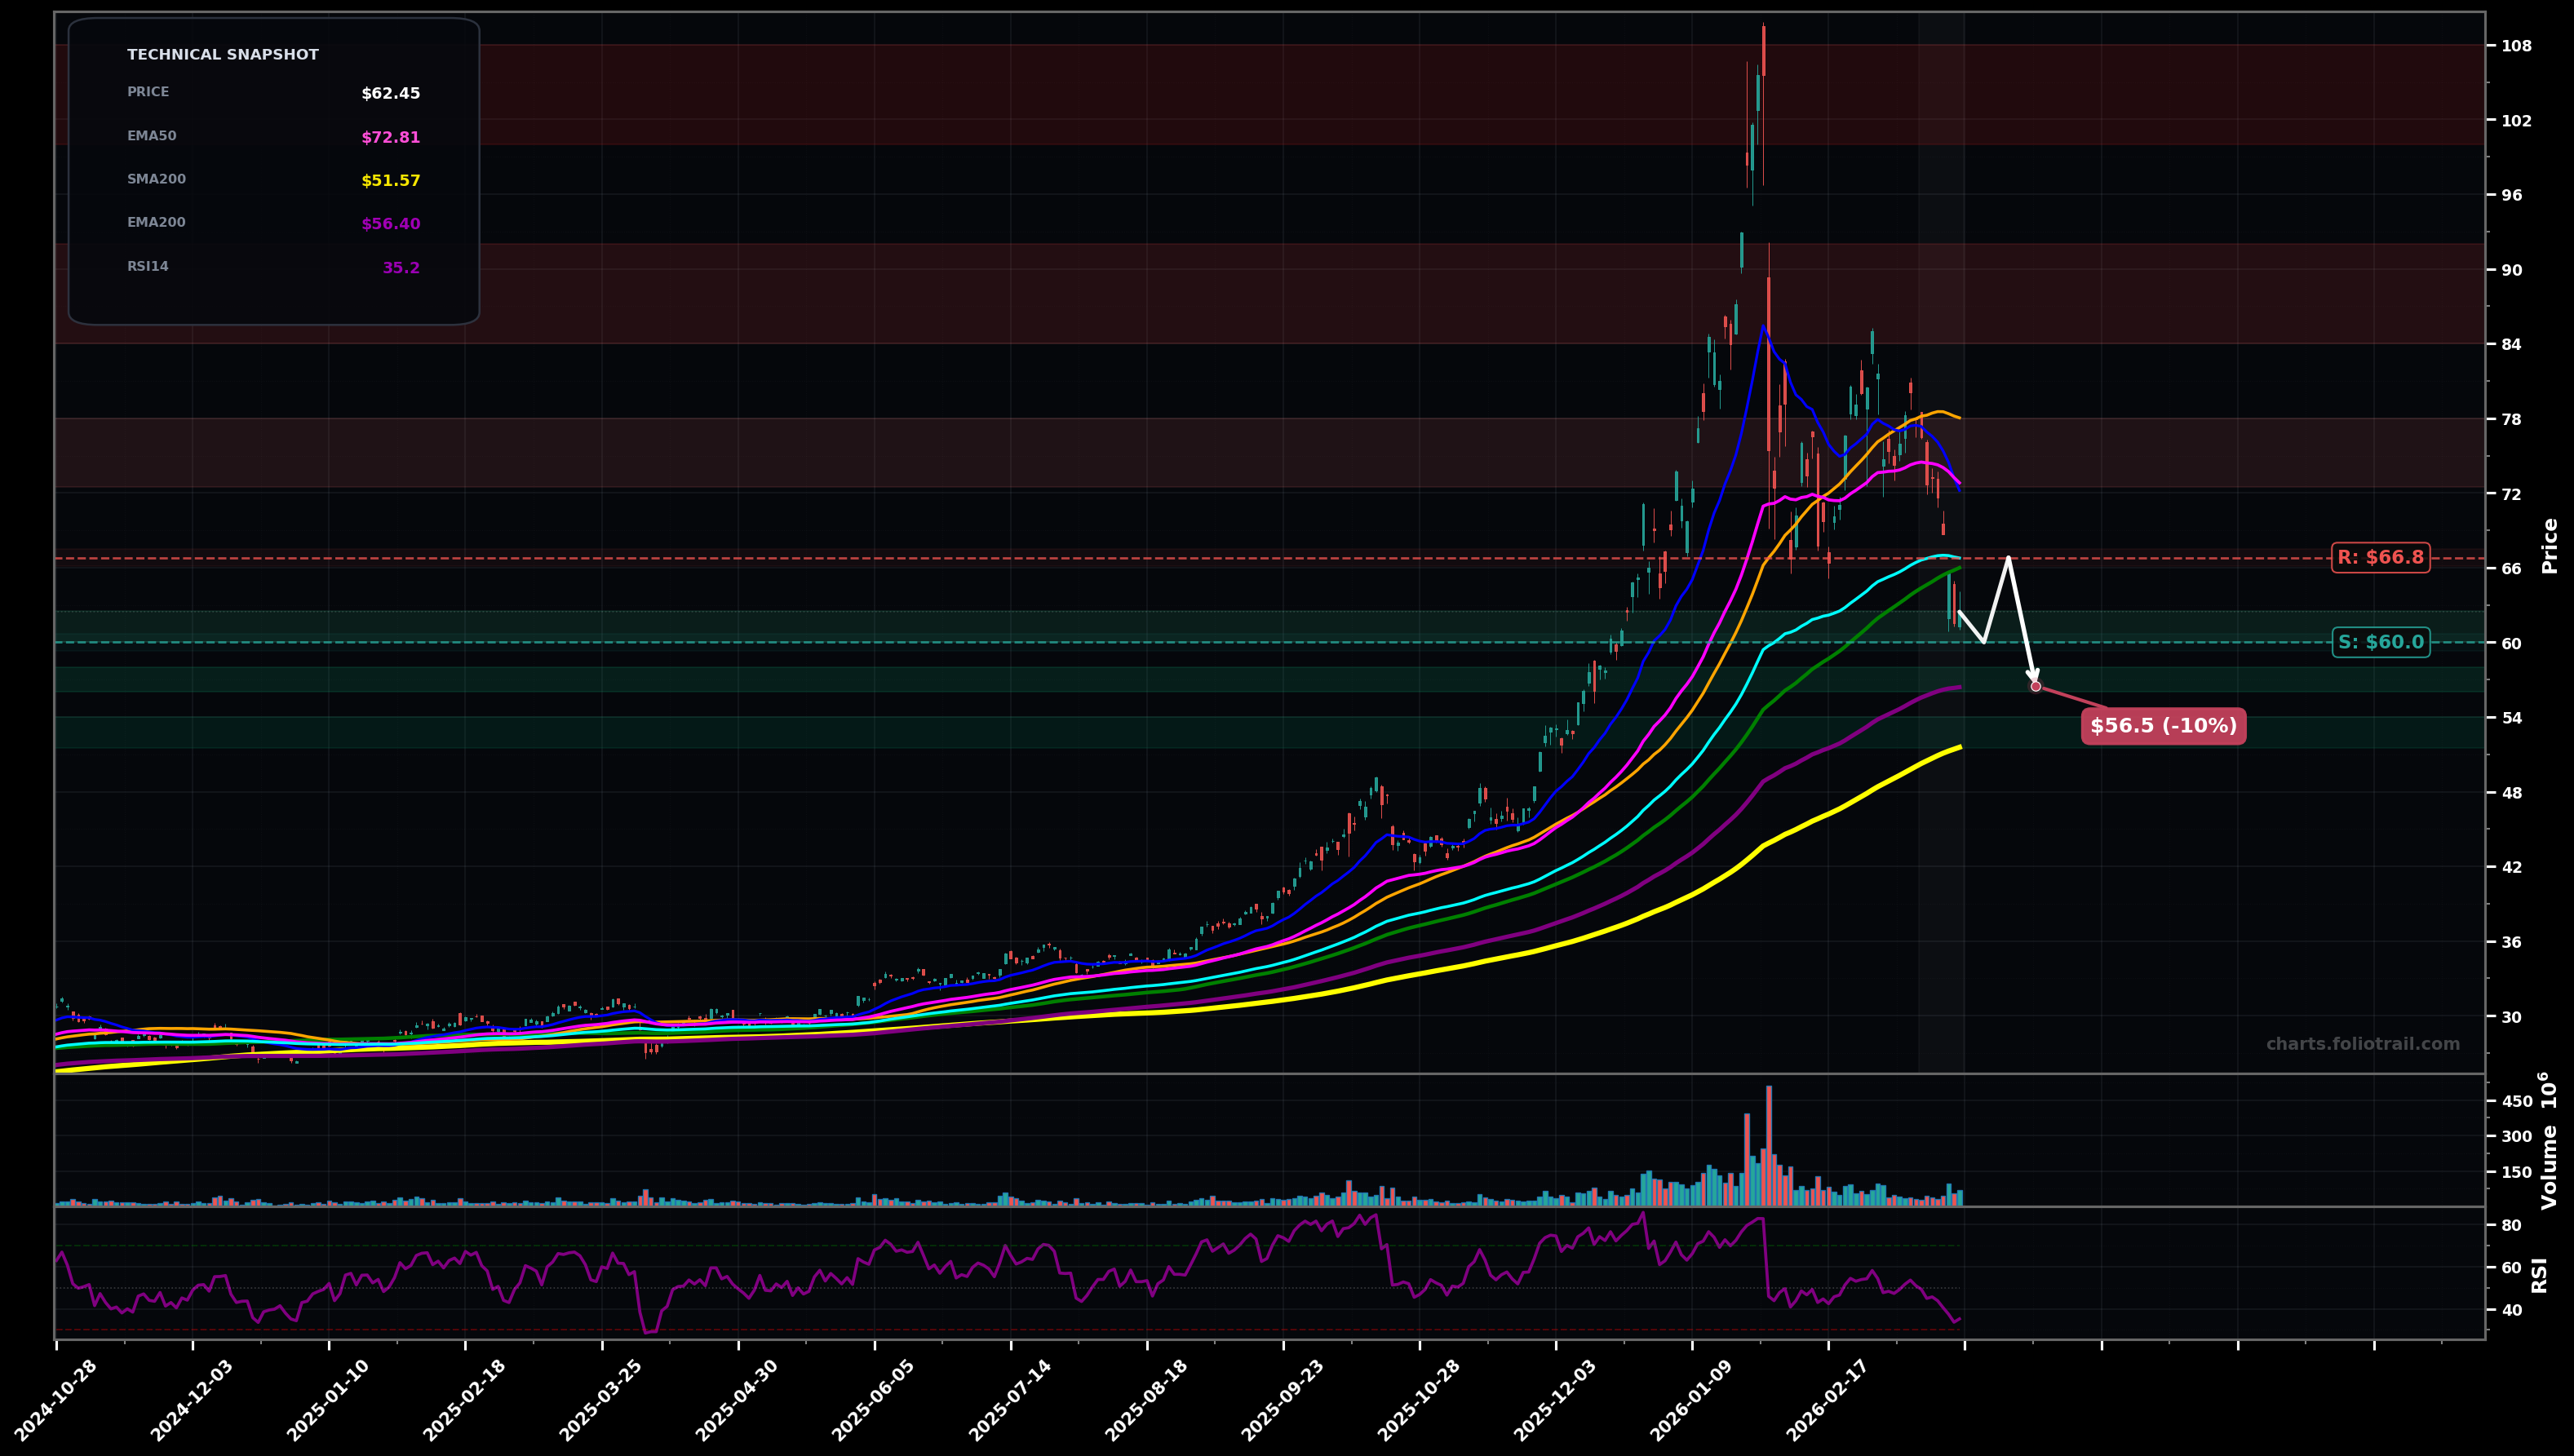
As of March 23, 2026, SLV (iShares Silver Trust) is in a downtrend state on the daily chart, with a confidence level of 74%. Key support is at $60.0 and key resistance at $66.8. Sharp selloff from the $100+ blow-off top; price now $62.45, under EMA50 ($72.81) and EMA100 ($66.77) with weak RSI (35.24); bounced but failed to reclaim mid-MAs.
Bearish continuation: rejection under EMA100 (~$66.8) then a support test; if $60 breaks, price gravitates toward the EMA200/SMA200 cluster and prior breakout zone.
Bullish relief/base: hold $60, carve a HL, then reclaim EMA100; move into a mean-reversion rally toward EMA50/SMA50 resistance band.
Daily close below $60.00 (break of the most recent swing-low support zone) would confirm continued downtrend pressure.
Two consecutive daily closes back above $66.80 (EMA100 area) would invalidate the immediate downtrend control and shift toward a base/reversal attempt.
Scale-in around $60 swing support first; add on breakdown/flush toward EMA200 (~$56.4); heavy add near SMA200 (~$51.6) where long-term trend support typically attracts demand.
Trim into overhead MA supply (EMA50/SMA50/SMA100 band) then heavier trims into prior distribution zones; full exit if price revisits the blow-off top area where volatility/reversal risk is highest.
As of March 23, 2026, SLV (iShares Silver Trust) is in a downtrend state on the daily chart with 74% confidence. Sharp selloff from the $100+ blow-off top; price now $62.45, under EMA50 ($72.81) and EMA100 ($66.77) with weak RSI (35.24); bounced but failed to reclaim mid-MAs.
On the daily timeframe, SLV has key support at $60.0 and key resistance at $66.8. The most likely scenario (bearish) targets $60.0 and $56.5, with a revert level at $66.8.
SLV (iShares Silver Trust) is currently classified as downtrend on the daily chart, with 74% confidence. Confirmation requires: Daily close below $60.00 (break of the most recent swing-low support zone) would confirm continued downtrend pressure. This would be invalidated by: Two consecutive daily closes back above $66.80 (EMA100 area) would invalidate the immediate downtrend control and shift toward a base/reversal attempt.
The most likely scenario (bearish) targets $60.0 and $56.5, with a revert level at $66.8. The alternative scenario (bullish) targets $66.8 and $72.8.
All content on this website — including charts, analysis, price targets, support/resistance levels, and position zones — is generated entirely by AI and provided for educational and informational purposes only.
This is not financial advice. NEXUSNOIR VENTURES SL (the operator of this website) is not a registered investment adviser or broker-dealer. You should not make investment decisions based solely on this information. Always do your own research and consult a qualified financial advisor.
By continuing, you acknowledge that you have read and agree to our full disclaimer & terms of use and privacy policy.