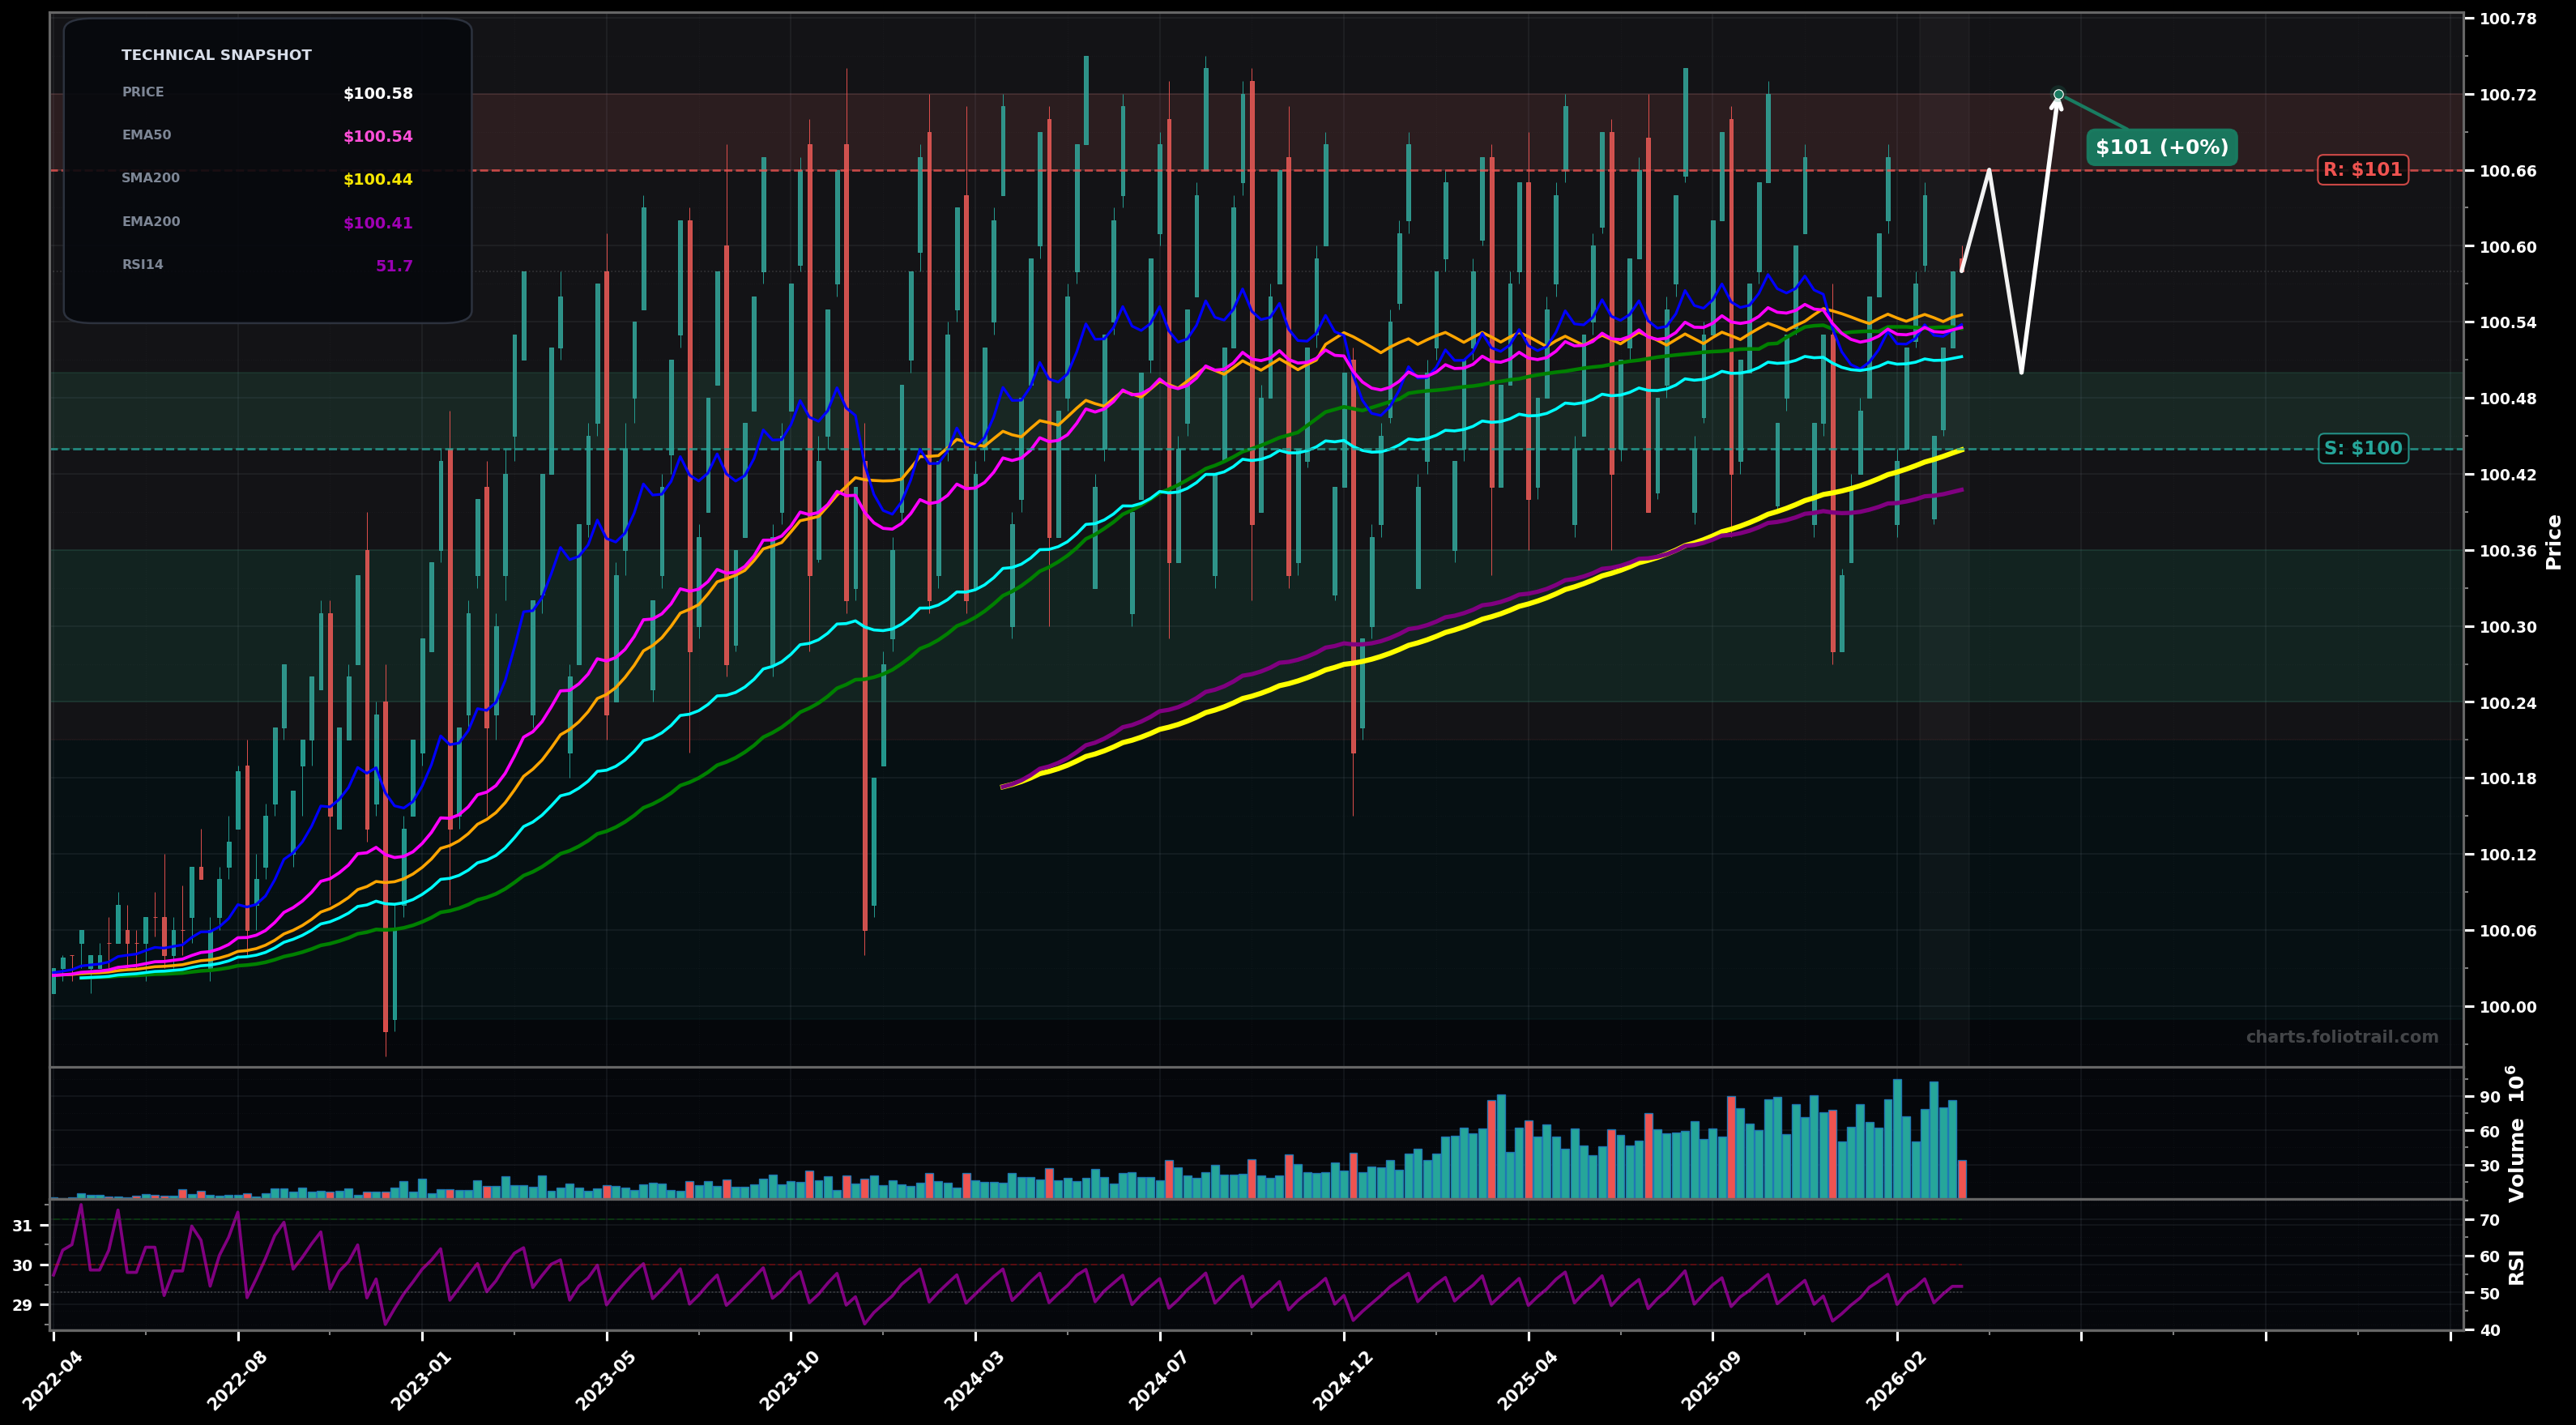
As of March 24, 2026, SGOV (iShares 0-3 Month Treasury Bond ETF) is in a choppy range state on the weekly chart, with a confidence level of 72%. Key support is at $100 and key resistance at $101. Tight weekly range around $100.6 with overlapping candles; price sitting on a cluster of short-term MAs while long-term MAs rise underneath.
Range continuation: mean-reversion between MA cluster (~$100.50-$100.55) and the upper band (~$100.66-$100.72) as distribution yield accrual keeps price grinding but capped.
Downside range break: a weekly close under the rising longer-term averages (SMA200/EMA200 area) triggers a quick pullback toward the prior swing-low zone before stabilizing.
2+ weekly closes holding above $100.60 (then range resolves upward toward prior highs).
Weekly close below $100.40 (breaks the key base/MAs cluster and shifts odds to a deeper mean-reversion).
Buy bias near rising SMA200/EMA200 support ($100.4ish) and add on flushes toward prior wick lows; invalidation if the range fails via sustained closes below the MA base.
Trim into repeated weekly upper-range rejections (prior highs/upper band); full exit only if price becomes unusually stretched above the established SGOV range.
As of March 24, 2026, SGOV (iShares 0-3 Month Treasury Bond ETF) is in a choppy range state on the weekly chart with 72% confidence. Tight weekly range around $100.6 with overlapping candles; price sitting on a cluster of short-term MAs while long-term MAs rise underneath.
On the weekly timeframe, SGOV has key support at $100 and key resistance at $101. The most likely scenario (bullish) targets $101 and $101, with a revert level at $100.
SGOV (iShares 0-3 Month Treasury Bond ETF) is currently classified as choppy range on the weekly chart, with 72% confidence. Confirmation requires: 2+ weekly closes holding above $100.60 (then range resolves upward toward prior highs). This would be invalidated by: Weekly close below $100.40 (breaks the key base/MAs cluster and shifts odds to a deeper mean-reversion).
The most likely scenario (bullish) targets $101 and $101, with a revert level at $100. The alternative scenario (bearish) targets $100 and $100.
All content on this website — including charts, analysis, price targets, support/resistance levels, and position zones — is generated entirely by AI and provided for educational and informational purposes only.
This is not financial advice. NEXUSNOIR VENTURES SL (the operator of this website) is not a registered investment adviser or broker-dealer. You should not make investment decisions based solely on this information. Always do your own research and consult a qualified financial advisor.
By continuing, you acknowledge that you have read and agree to our full disclaimer & terms of use and privacy policy.