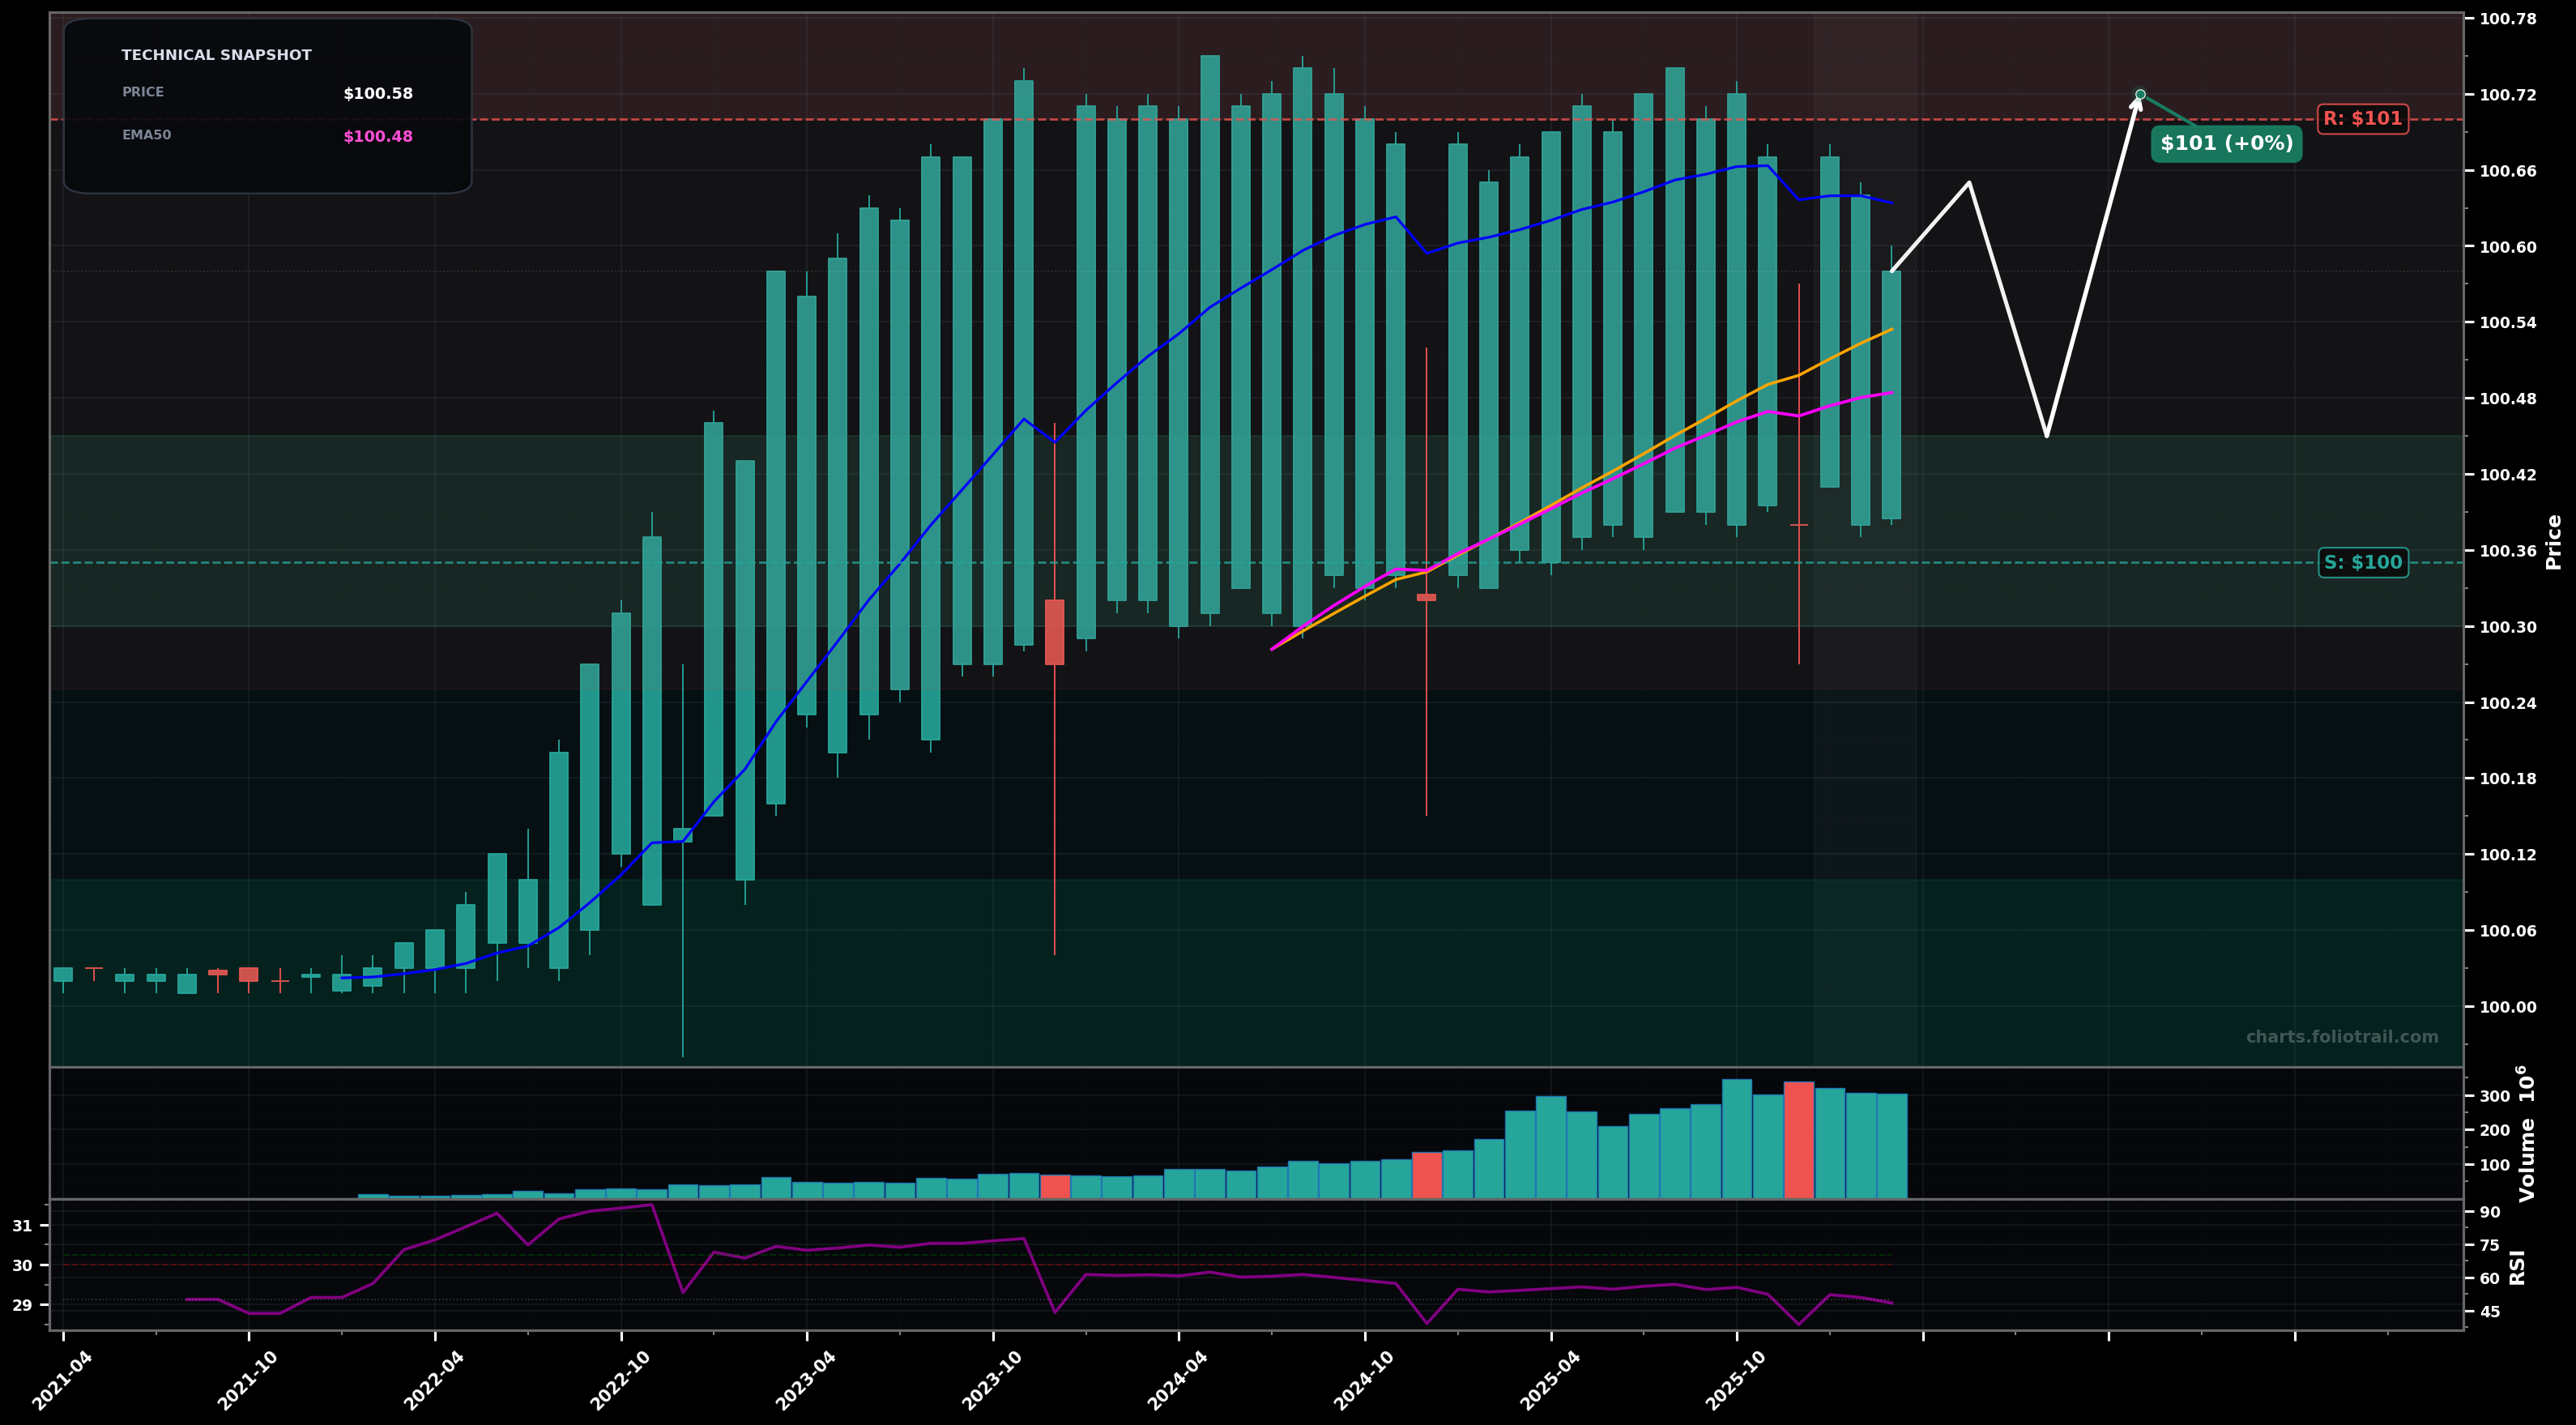
As of March 24, 2026, SGOV (iShares 0-3 Month Treasury Bond ETF) is in a choppy range state on the monthly chart, with a confidence level of 64%. Key support is at $100 and key resistance at $101. After a long low-vol grind up, SGOV is now chopping sideways near $100.6 with a slight pullback; price sits around/just above the short MAs while RSI (~48) is neutral.
Range continuation: mean-revert around the short MAs, with a gentle drift back toward the upper bound as carry accrues (typical for ultra-short T-bill ETFs).
Range breakdown: a softer print and a close below the short-MA cluster triggers a dip toward the lower part of the visible consolidation before stabilizing.
2+ monthly closes holding above ~$100.65 (recent range top / near the EMA20 area) would confirm a breakout attempt from the chop
A monthly close below ~$100.35 (range support + around the EMA50/SMA50 zone) would invalidate the chop-to-upside bias and shift toward breakdown risk
Prefer scaling near range support and any sweep/undercut of the most recent swing low reference; this product historically mean-reverts and volatility is low.
Trim into repeated tests/overshoots of the range top (price stretched vs recent monthly band); fully exit only on an unusually extended spike above the established ceiling.
As of March 24, 2026, SGOV (iShares 0-3 Month Treasury Bond ETF) is in a choppy range state on the monthly chart with 64% confidence. After a long low-vol grind up, SGOV is now chopping sideways near $100.6 with a slight pullback; price sits around/just above the short MAs while RSI (~48) is neutral.
On the monthly timeframe, SGOV has key support at $100 and key resistance at $101. The most likely scenario (bullish) targets $101 and $101, with a revert level at $100.
SGOV (iShares 0-3 Month Treasury Bond ETF) is currently classified as choppy range on the monthly chart, with 64% confidence. Confirmation requires: 2+ monthly closes holding above ~$100.65 (recent range top / near the EMA20 area) would confirm a breakout attempt from the chop This would be invalidated by: A monthly close below ~$100.35 (range support + around the EMA50/SMA50 zone) would invalidate the chop-to-upside bias and shift toward breakdown risk
The most likely scenario (bullish) targets $101 and $101, with a revert level at $100. The alternative scenario (bearish) targets $100 and $100.
All content on this website — including charts, analysis, price targets, support/resistance levels, and position zones — is generated entirely by AI and provided for educational and informational purposes only.
This is not financial advice. NEXUSNOIR VENTURES SL (the operator of this website) is not a registered investment adviser or broker-dealer. You should not make investment decisions based solely on this information. Always do your own research and consult a qualified financial advisor.
By continuing, you acknowledge that you have read and agree to our full disclaimer & terms of use and privacy policy.