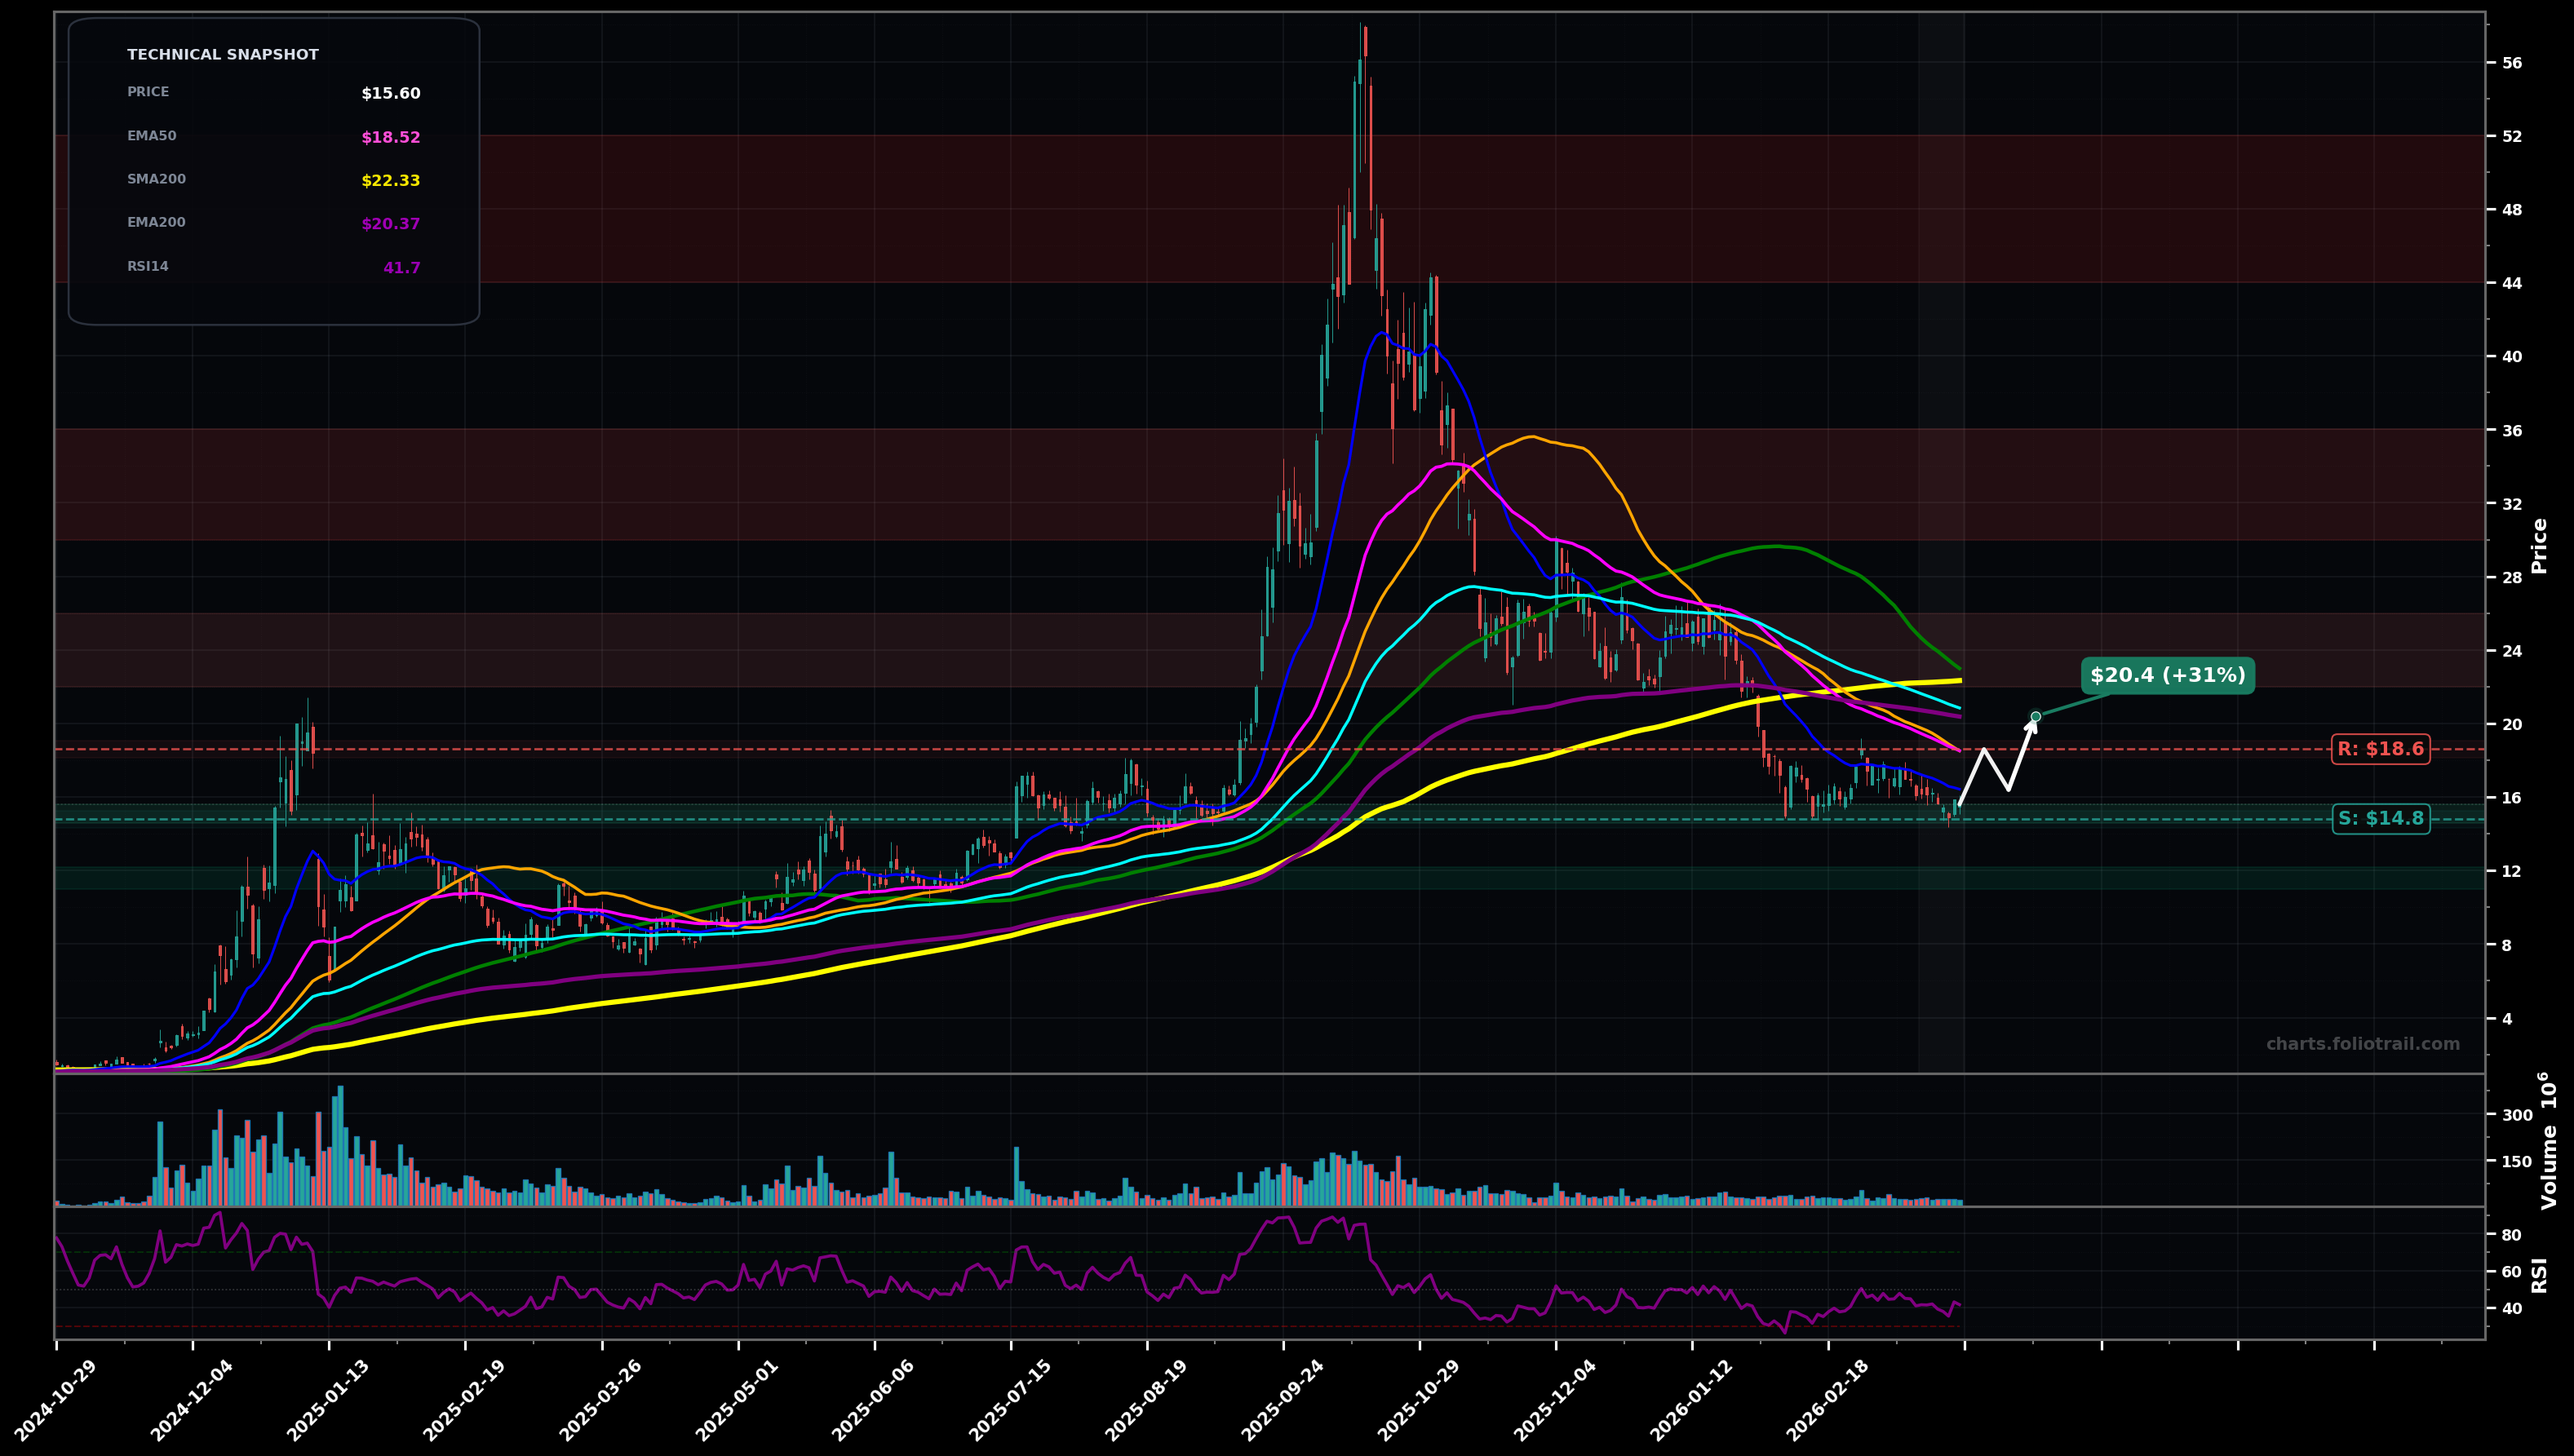
As of March 25, 2026, RGTI (Rigetti Computing, Inc.) is in a downtrend state on the daily chart, with a confidence level of 76%. Key support is at $14.8 and key resistance at $18.6. Price is around $15.60, making a sequence of LH/LL since the $50+ blow-off top and holding a weak sideways-to-down drift below all key MAs; RSI ~41 shows muted momentum.
Base attempt between ~$14.80 support and ~$18.60 resistance, then a mean-reversion pop into the MA cluster (EMA50/SMA50) where sellers likely defend; if accepted above, continuation toward the next overhead MA shelf.
Support fails and the downtrend resumes with a flush below the recent base; potential capitulation move into the prior demand pocket, then a rebound/throwback from below.
Daily close below $14.80 (break of the most recent swing-low support zone) would confirm continued downtrend pressure
Two daily closes back above $18.60 (reclaim of EMA50/SMA50 area) would invalidate the immediate downtrend bias
DCA anchored to the current swing-low support ($14.8) with adds on breakdown-to-demand zones; heavy add only near the next larger support pocket if scenario_2 plays out.
Trim into major overhead MA/structure resistance (SMA100/200 region ~$22–$23 first) and progressively derisk into prior distribution zones from the post-spike selloff; full exit near the prior blow-off supply ($44–$52).
As of March 25, 2026, RGTI (Rigetti Computing, Inc.) is in a downtrend state on the daily chart with 76% confidence. Price is around $15.60, making a sequence of LH/LL since the $50+ blow-off top and holding a weak sideways-to-down drift below all key MAs; RSI ~41 shows muted momentum.
On the daily timeframe, RGTI has key support at $14.8 and key resistance at $18.6. The most likely scenario (bullish) targets $18.6 and $20.4, with a revert level at $16.4.
RGTI (Rigetti Computing, Inc.) is currently classified as downtrend on the daily chart, with 76% confidence. Confirmation requires: Daily close below $14.80 (break of the most recent swing-low support zone) would confirm continued downtrend pressure This would be invalidated by: Two daily closes back above $18.60 (reclaim of EMA50/SMA50 area) would invalidate the immediate downtrend bias
The most likely scenario (bullish) targets $18.6 and $20.4, with a revert level at $16.4. The alternative scenario (bearish) targets $13.2 and $11.2.
Multi-layer AI agents analyse 200+ stocks across daily, weekly, and monthly timeframes — producing market state classifications, price scenarios with targets, and position entry/exit levels. Updated every trading day after market close. No paywall. No sign-up required.
Built by Foliotrail.
All content on this website — including charts, analysis, price targets, support/resistance levels, and position zones — is generated entirely by AI and provided for educational and informational purposes only.
This is not financial advice. NEXUSNOIR VENTURES SL (the operator of this website) is not a registered investment adviser or broker-dealer. You should not make investment decisions based solely on this information. Always do your own research and consult a qualified financial advisor.
By continuing, you acknowledge that you have read and agree to our full disclaimer & terms of use and privacy policy.