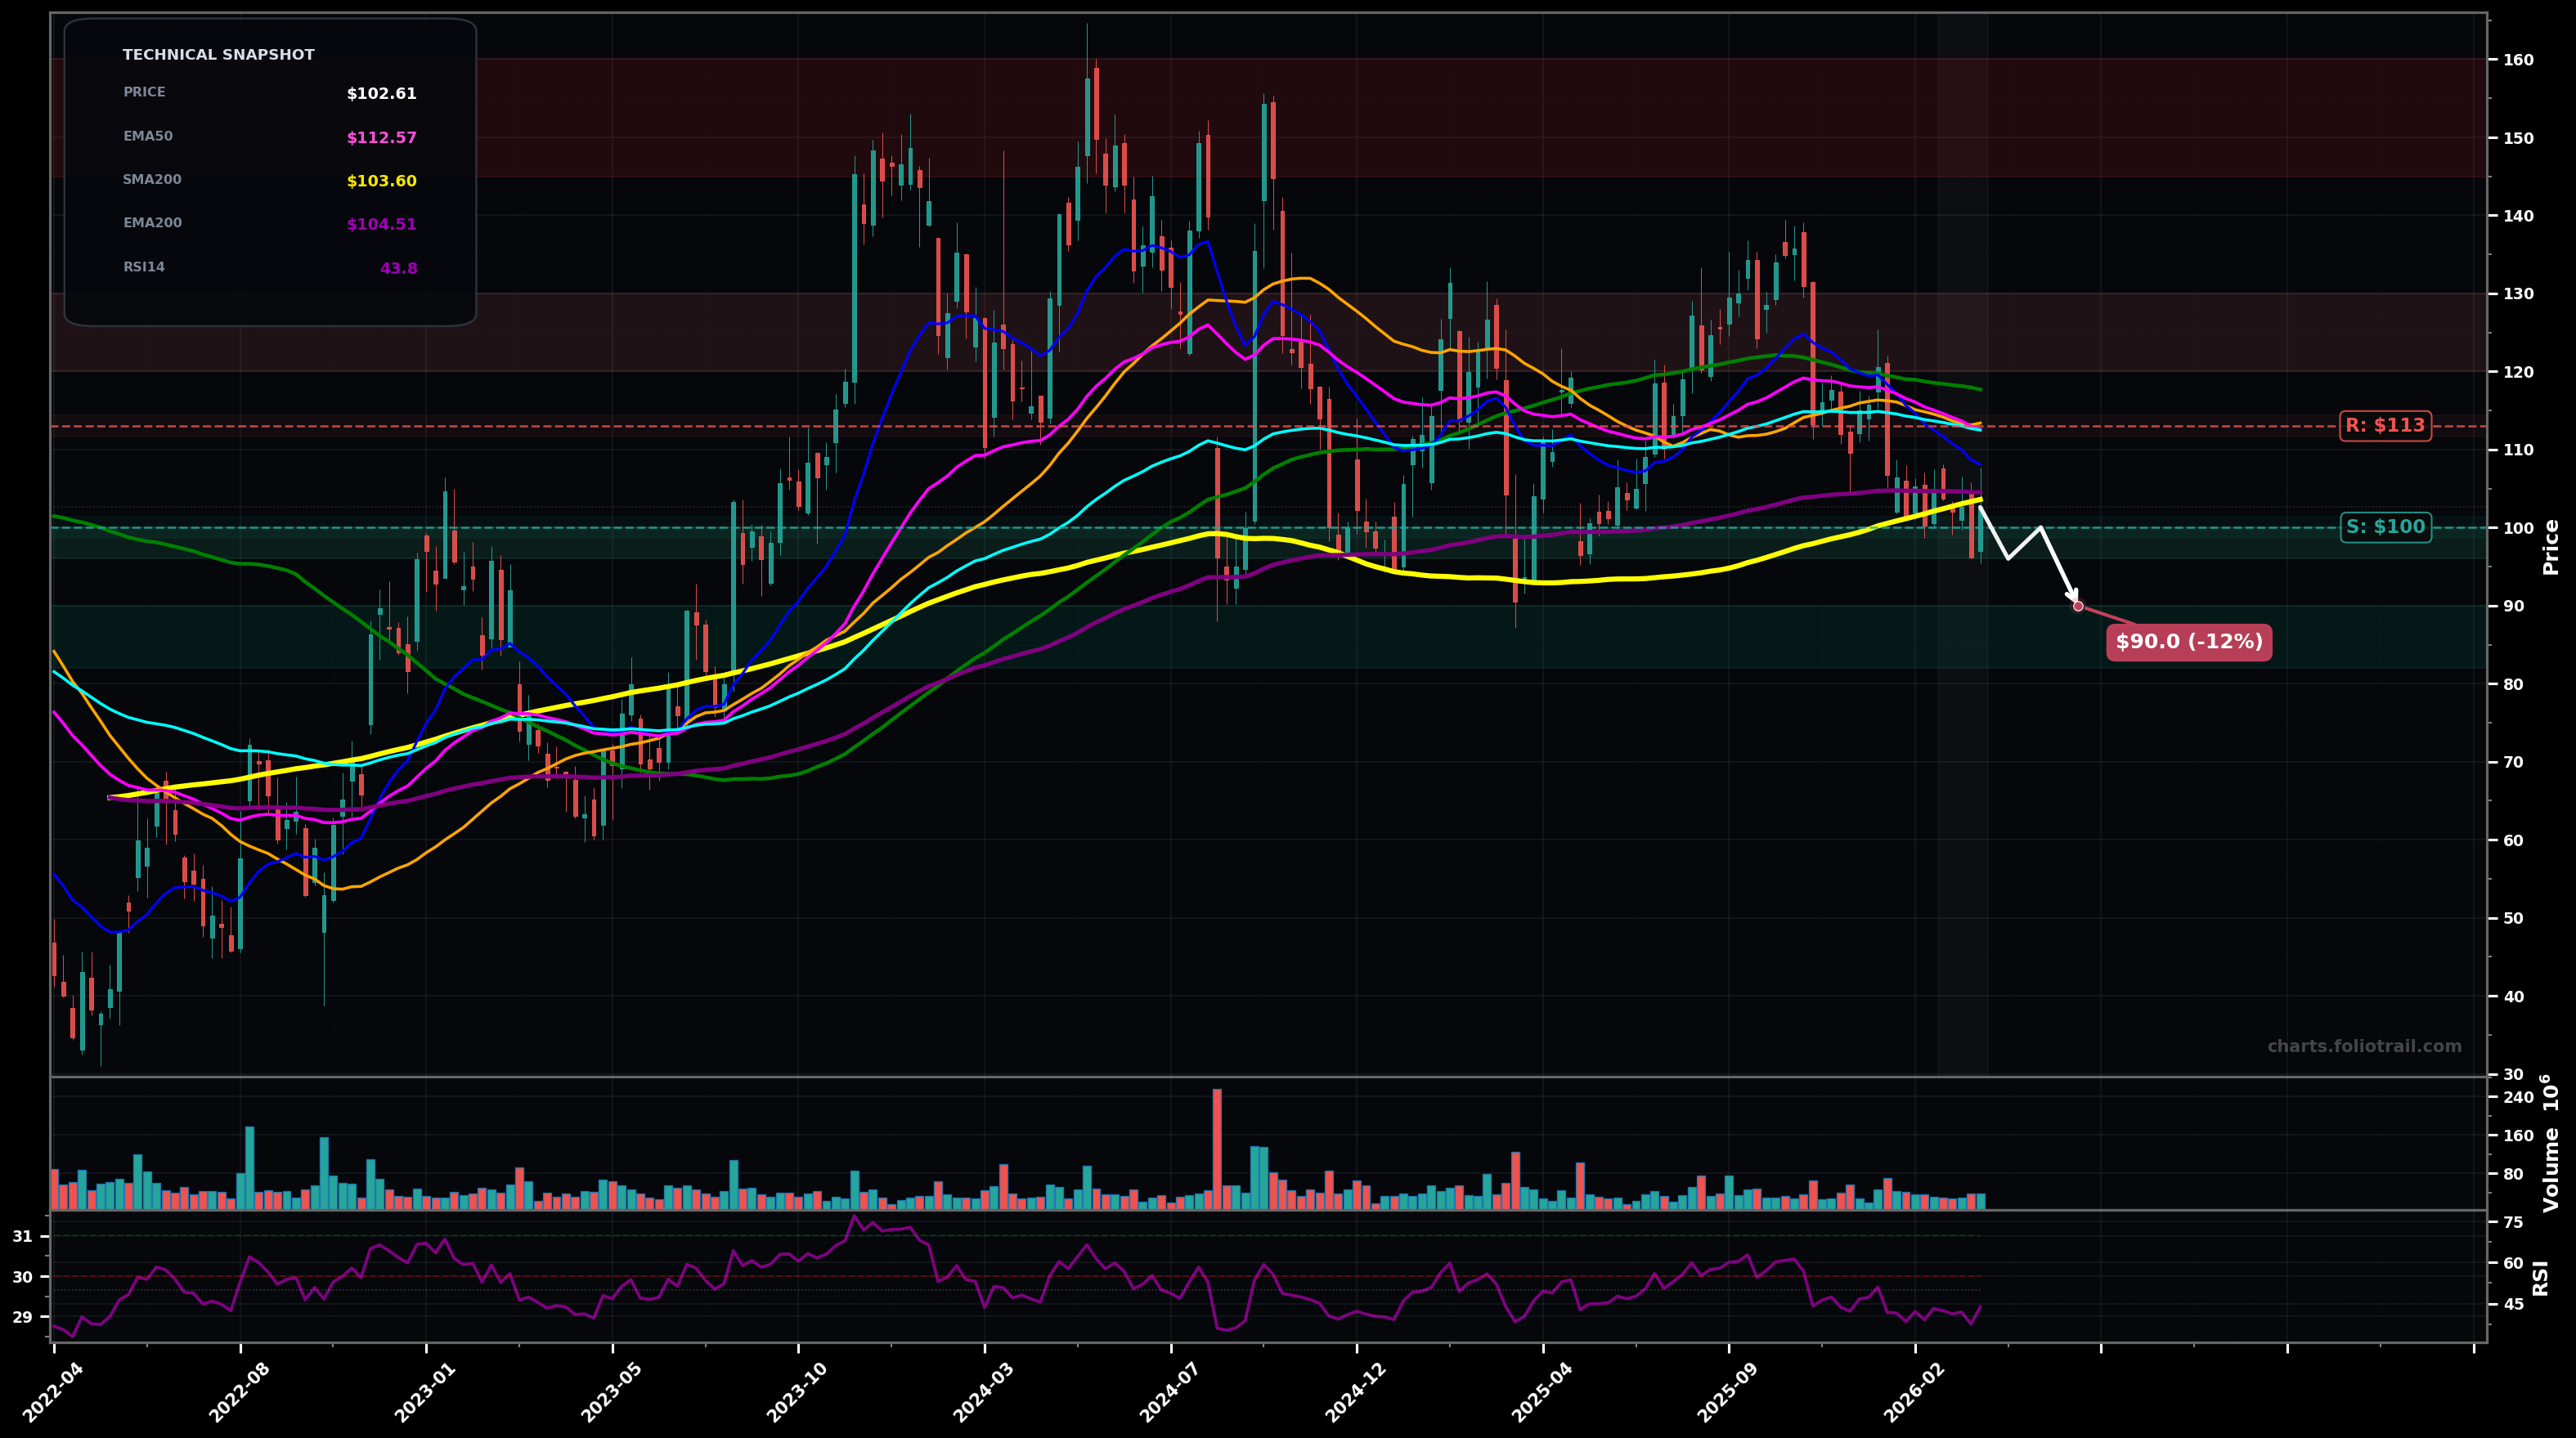
As of March 26, 2026, PDD (PDD Holdings Inc. American Depositary Shares) is in a downtrend state on the weekly chart, with a confidence level of 62%. Key support is at $100 and key resistance at $113. Weekly price at ~$102.61 is grinding lower into the clustered long-term MAs; below EMA50/EMA100 (~$112.6/$112.5) and just below SMA200 (~$103.6) while sitting slightly under EMA200 (~$104.5).
Bearish continuation: lose ~$100 support, quick flush into the prior pivot/MA demand area, then attempt a bounce (likely wave C/5-type continuation before basing).
Base and reversal attempt: defend ~$100 and reclaim the $112-$113 MA cluster (EMA50/EMA100/SMA50 area), triggering a squeeze toward the next weekly supply.
Weekly close below $100 would confirm continuation toward the next demand zone.
2+ weekly closes back above $113 would invalidate the downtrend bias and favor a reversal/base-breakout.
Buy-the-dip plan keyed to the $100 breakdown/retest and the next weekly pivot shelf ($90s); heavy adds only if a deeper capitulation tags the next major demand below the visible range.
Trim into the overhead supply bands where prior weekly highs failed and where a larger Elliott corrective rally would likely terminate (back into the $120s/$130s first, then prior distribution near $145+).
As of March 26, 2026, PDD (PDD Holdings Inc. American Depositary Shares) is in a downtrend state on the weekly chart with 62% confidence. Weekly price at ~$102.61 is grinding lower into the clustered long-term MAs; below EMA50/EMA100 (~$112.6/$112.5) and just below SMA200 (~$103.6) while sitting slightly under EMA200 (~$104.5).
On the weekly timeframe, PDD has key support at $100 and key resistance at $113. The most likely scenario (bearish) targets $96.0 and $90.0, with a revert level at $100.
PDD (PDD Holdings Inc. American Depositary Shares) is currently classified as downtrend on the weekly chart, with 62% confidence. Confirmation requires: Weekly close below $100 would confirm continuation toward the next demand zone. This would be invalidated by: 2+ weekly closes back above $113 would invalidate the downtrend bias and favor a reversal/base-breakout.
The most likely scenario (bearish) targets $96.0 and $90.0, with a revert level at $100. The alternative scenario (bullish) targets $113 and $120.
Multi-layer AI agents analyse 200+ stocks across daily, weekly, and monthly timeframes — producing market state classifications, price scenarios with targets, and position entry/exit levels. Updated every trading day after market close. No paywall. No sign-up required.
Built by Foliotrail.
All content on this website — including charts, analysis, price targets, support/resistance levels, and position zones — is generated entirely by AI and provided for educational and informational purposes only.
This is not financial advice. NEXUSNOIR VENTURES SL (the operator of this website) is not a registered investment adviser or broker-dealer. You should not make investment decisions based solely on this information. Always do your own research and consult a qualified financial advisor.
By continuing, you acknowledge that you have read and agree to our full disclaimer & terms of use and privacy policy.