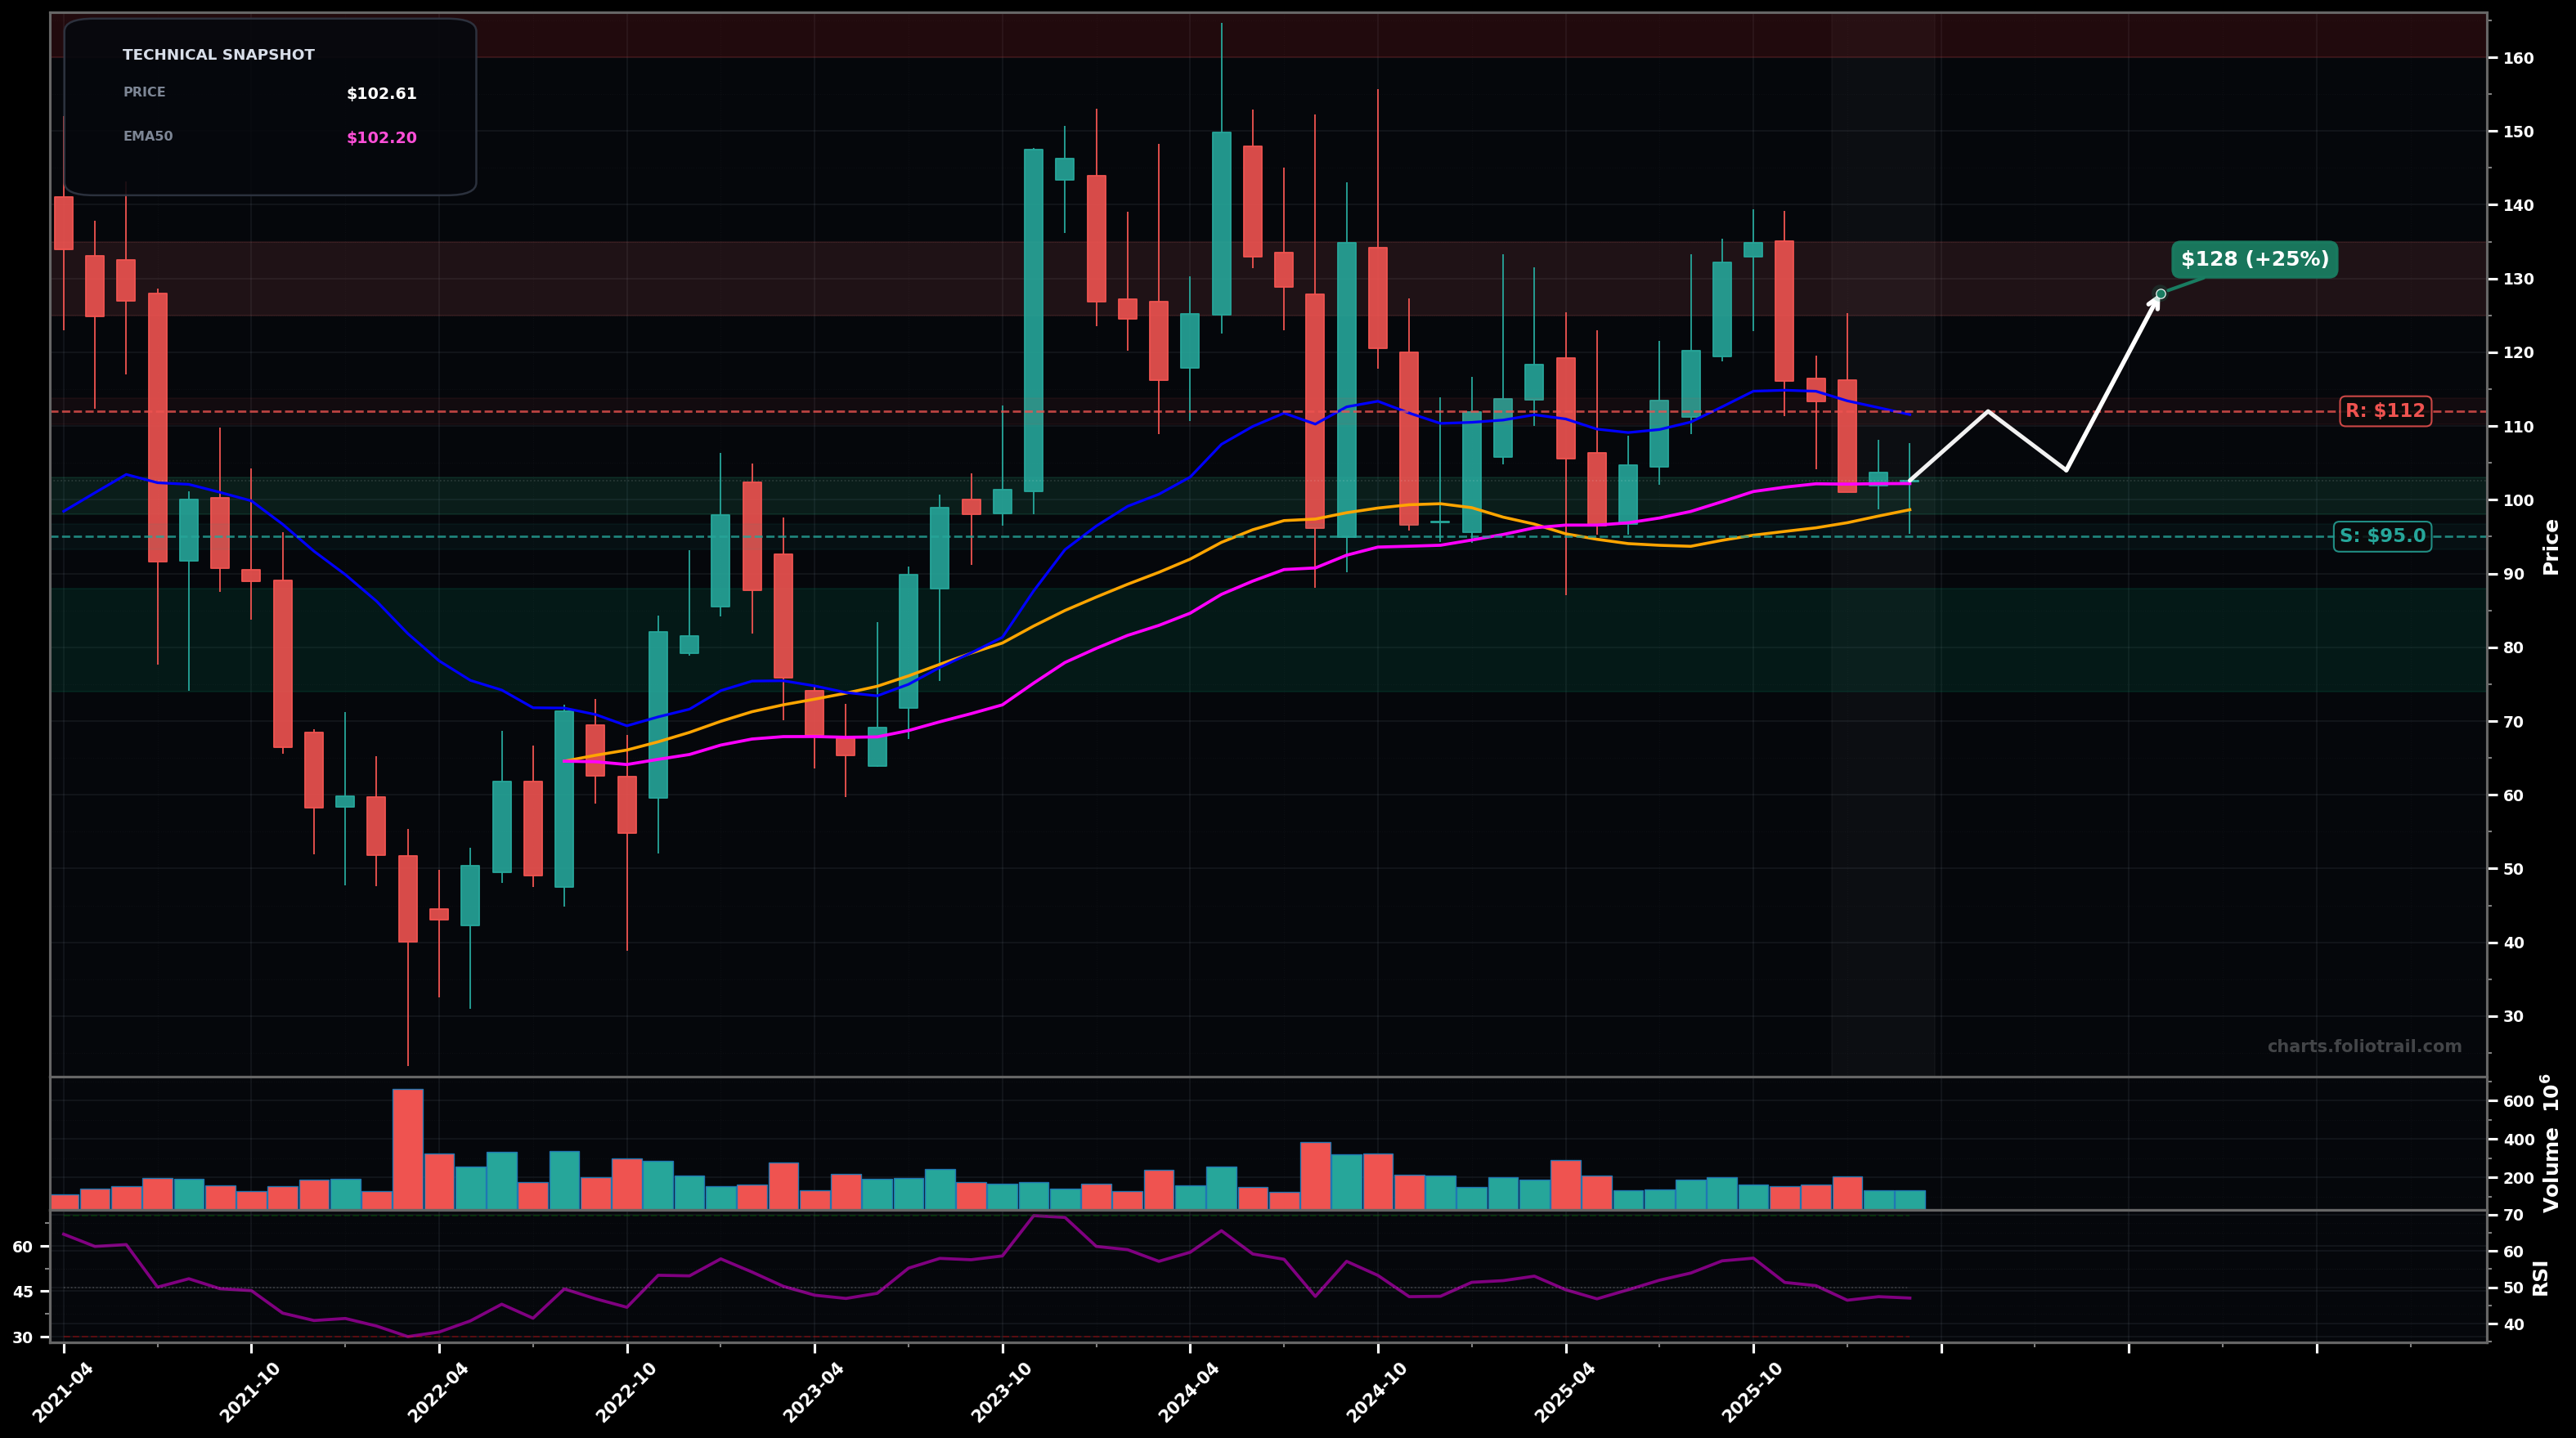
As of March 26, 2026, PDD (PDD Holdings Inc. American Depositary Shares) is in a choppy range state on the monthly chart, with a confidence level of 64%. Key support is at $95.0 and key resistance at $112. Monthly price is consolidating around $102.6, holding near the rising EMA50 (~$102.2) after a pullback from the ~$135 area; momentum is neutral (RSI ~47).
Range continues: buyers defend $95–$100, price rotates back toward the $110–$112 ceiling; if $112 breaks on monthly closes, a push to prior supply near $125–$135 follows.
Breakdown: failure to hold the $95 floor triggers a larger ABC-style monthly correction, targeting the prior base/support band; volatility expands on the downside.
2+ monthly closes above $112 (reclaim of the EMA20/near-term range ceiling)
Monthly close below $95 (range floor breaks, likely trend-down continuation)
Start near EMA50/value (~$102) with tight risk, add on a $95 support retest/undercut, heavy add only if capitulation into the prior base ($74–$88) occurs.
Trim into prior swing-supply zones (likely Fibonacci retrace/extension confluence from the $150 top), close if price gets back to/through the prior peak area with stretched distance from key MAs.
As of March 26, 2026, PDD (PDD Holdings Inc. American Depositary Shares) is in a choppy range state on the monthly chart with 64% confidence. Monthly price is consolidating around $102.6, holding near the rising EMA50 (~$102.2) after a pullback from the ~$135 area; momentum is neutral (RSI ~47).
On the monthly timeframe, PDD has key support at $95.0 and key resistance at $112. The most likely scenario (bullish) targets $112 and $128, with a revert level at $104.
PDD (PDD Holdings Inc. American Depositary Shares) is currently classified as choppy range on the monthly chart, with 64% confidence. Confirmation requires: 2+ monthly closes above $112 (reclaim of the EMA20/near-term range ceiling) This would be invalidated by: Monthly close below $95 (range floor breaks, likely trend-down continuation)
The most likely scenario (bullish) targets $112 and $128, with a revert level at $104. The alternative scenario (bearish) targets $88.0 and $74.0.
Multi-layer AI agents analyse 200+ stocks across daily, weekly, and monthly timeframes — producing market state classifications, price scenarios with targets, and position entry/exit levels. Updated every trading day after market close. No paywall. No sign-up required.
Built by Foliotrail.
All content on this website — including charts, analysis, price targets, support/resistance levels, and position zones — is generated entirely by AI and provided for educational and informational purposes only.
This is not financial advice. NEXUSNOIR VENTURES SL (the operator of this website) is not a registered investment adviser or broker-dealer. You should not make investment decisions based solely on this information. Always do your own research and consult a qualified financial advisor.
By continuing, you acknowledge that you have read and agree to our full disclaimer & terms of use and privacy policy.