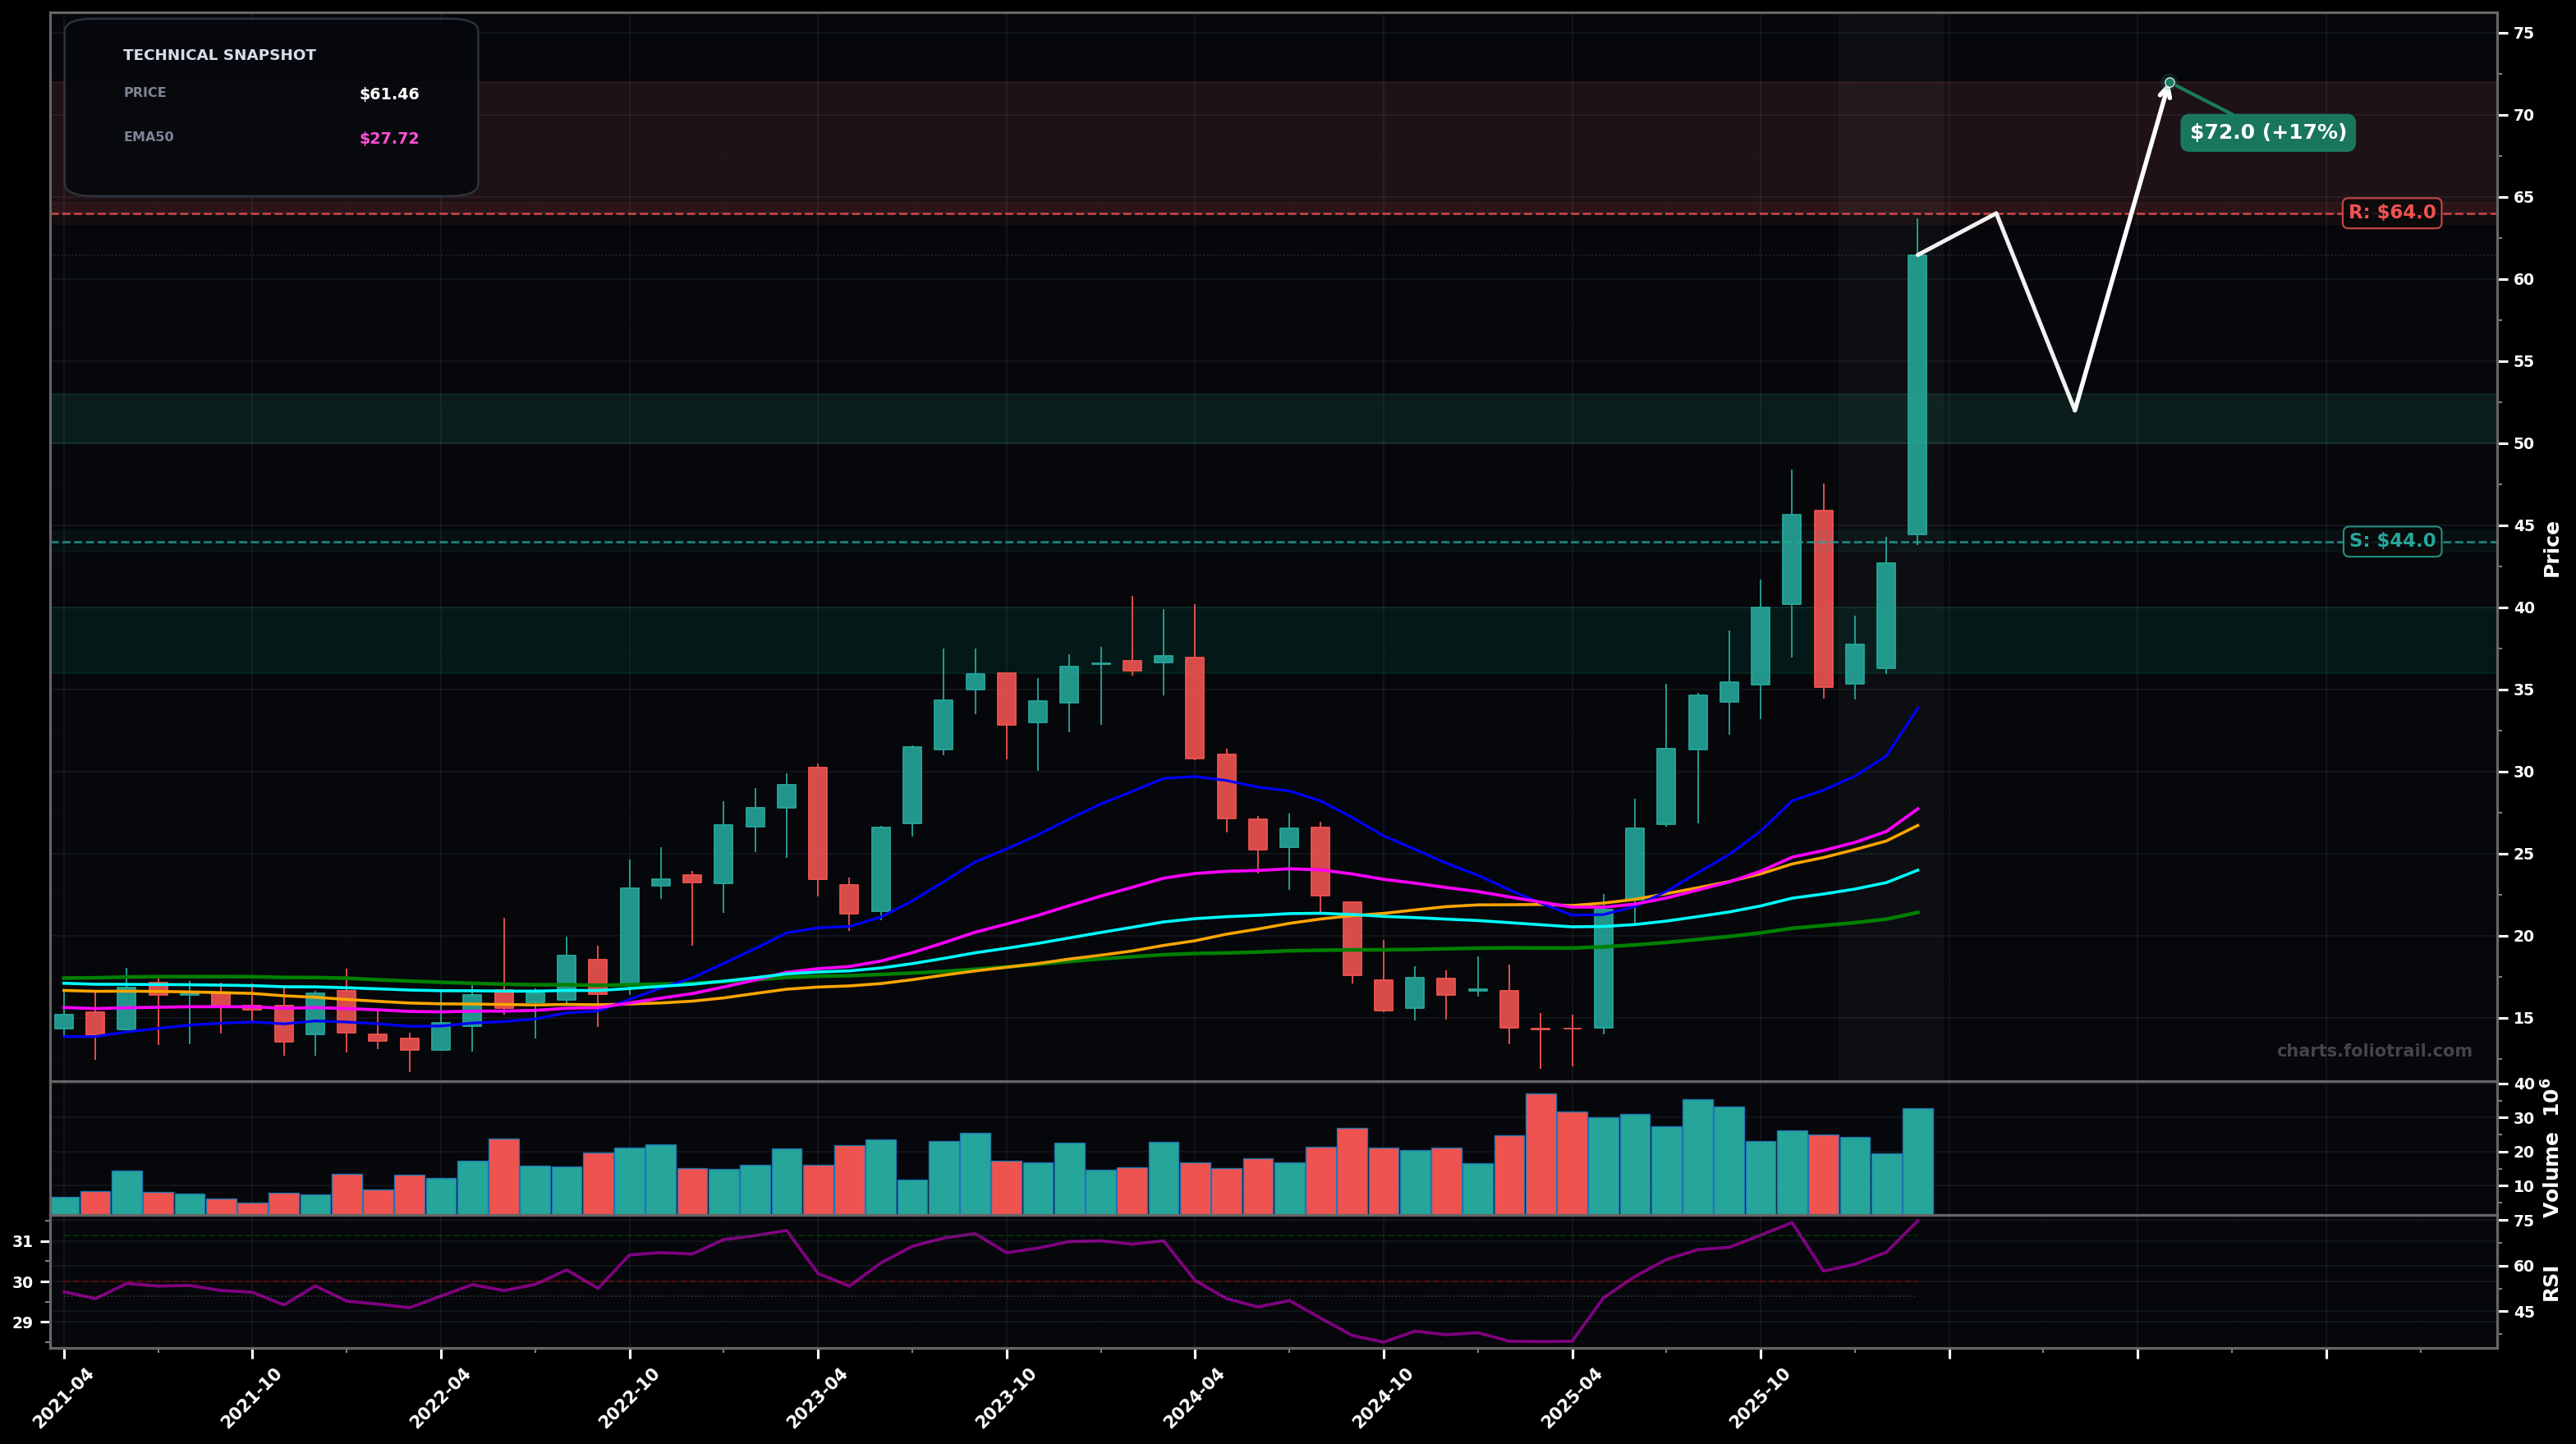
As of March 26, 2026, PARR (Par Pacific Holdings Inc.) is in a parabolic state on the monthly chart, with a confidence level of 72%. Key support is at $44.0 and key resistance at $64.0. Monthly breakout to new highs with a strong expansion candle; price is far above rising EMA50/EMA100 and RSI is elevated (~75).
Momentum continuation (Elliott: Wave 3/5 extension) with a brief consolidation, then another leg higher; watch for a shallow pullback that holds above the breakout shelf before pushing to the next fib extension zone.
Parabolic unwind: a sharper mean-reversion drop back toward the rising fast MAs (EMA50 area) / prior breakout zone, then a rebound attempt (Elliott: Wave 4-type correction).
Hold above $52 on 2+ monthly closes (no deep retrace) while EMA50 keeps rising
Monthly close below $44 (break of the last breakout base/impulse shelf)
Buy-the-dip only: $50-$53 is a shallow pullback/hold of breakout; $44-$48 is prior structure + probable fib retrace; $36-$40 aligns with deeper retrace toward rising mid/long MAs if a Wave-4 style correction expands.
In a parabolic state, trim into fib-extension/psychological zones above $64 as RSI/MA-stretch grows; heavier trimming above $72; consider full exit planning if price reaches extreme multi-year stretch ($85-$100) relative to the MA stack.
As of March 26, 2026, PARR (Par Pacific Holdings Inc.) is in a parabolic state on the monthly chart with 72% confidence. Monthly breakout to new highs with a strong expansion candle; price is far above rising EMA50/EMA100 and RSI is elevated (~75).
On the monthly timeframe, PARR has key support at $44.0 and key resistance at $64.0. The most likely scenario (bullish) targets $64.0 and $72.0, with a revert level at $52.0.
PARR (Par Pacific Holdings Inc.) is currently classified as parabolic on the monthly chart, with 72% confidence. Confirmation requires: Hold above $52 on 2+ monthly closes (no deep retrace) while EMA50 keeps rising This would be invalidated by: Monthly close below $44 (break of the last breakout base/impulse shelf)
The most likely scenario (bullish) targets $64.0 and $72.0, with a revert level at $52.0. The alternative scenario (bearish) targets $52.0 and $44.0.
Multi-layer AI agents analyse 200+ stocks across daily, weekly, and monthly timeframes — producing market state classifications, price scenarios with targets, and position entry/exit levels. Updated every trading day after market close. No paywall. No sign-up required.
Built by Foliotrail.
All content on this website — including charts, analysis, price targets, support/resistance levels, and position zones — is generated entirely by AI and provided for educational and informational purposes only.
This is not financial advice. NEXUSNOIR VENTURES SL (the operator of this website) is not a registered investment adviser or broker-dealer. You should not make investment decisions based solely on this information. Always do your own research and consult a qualified financial advisor.
By continuing, you acknowledge that you have read and agree to our full disclaimer & terms of use and privacy policy.