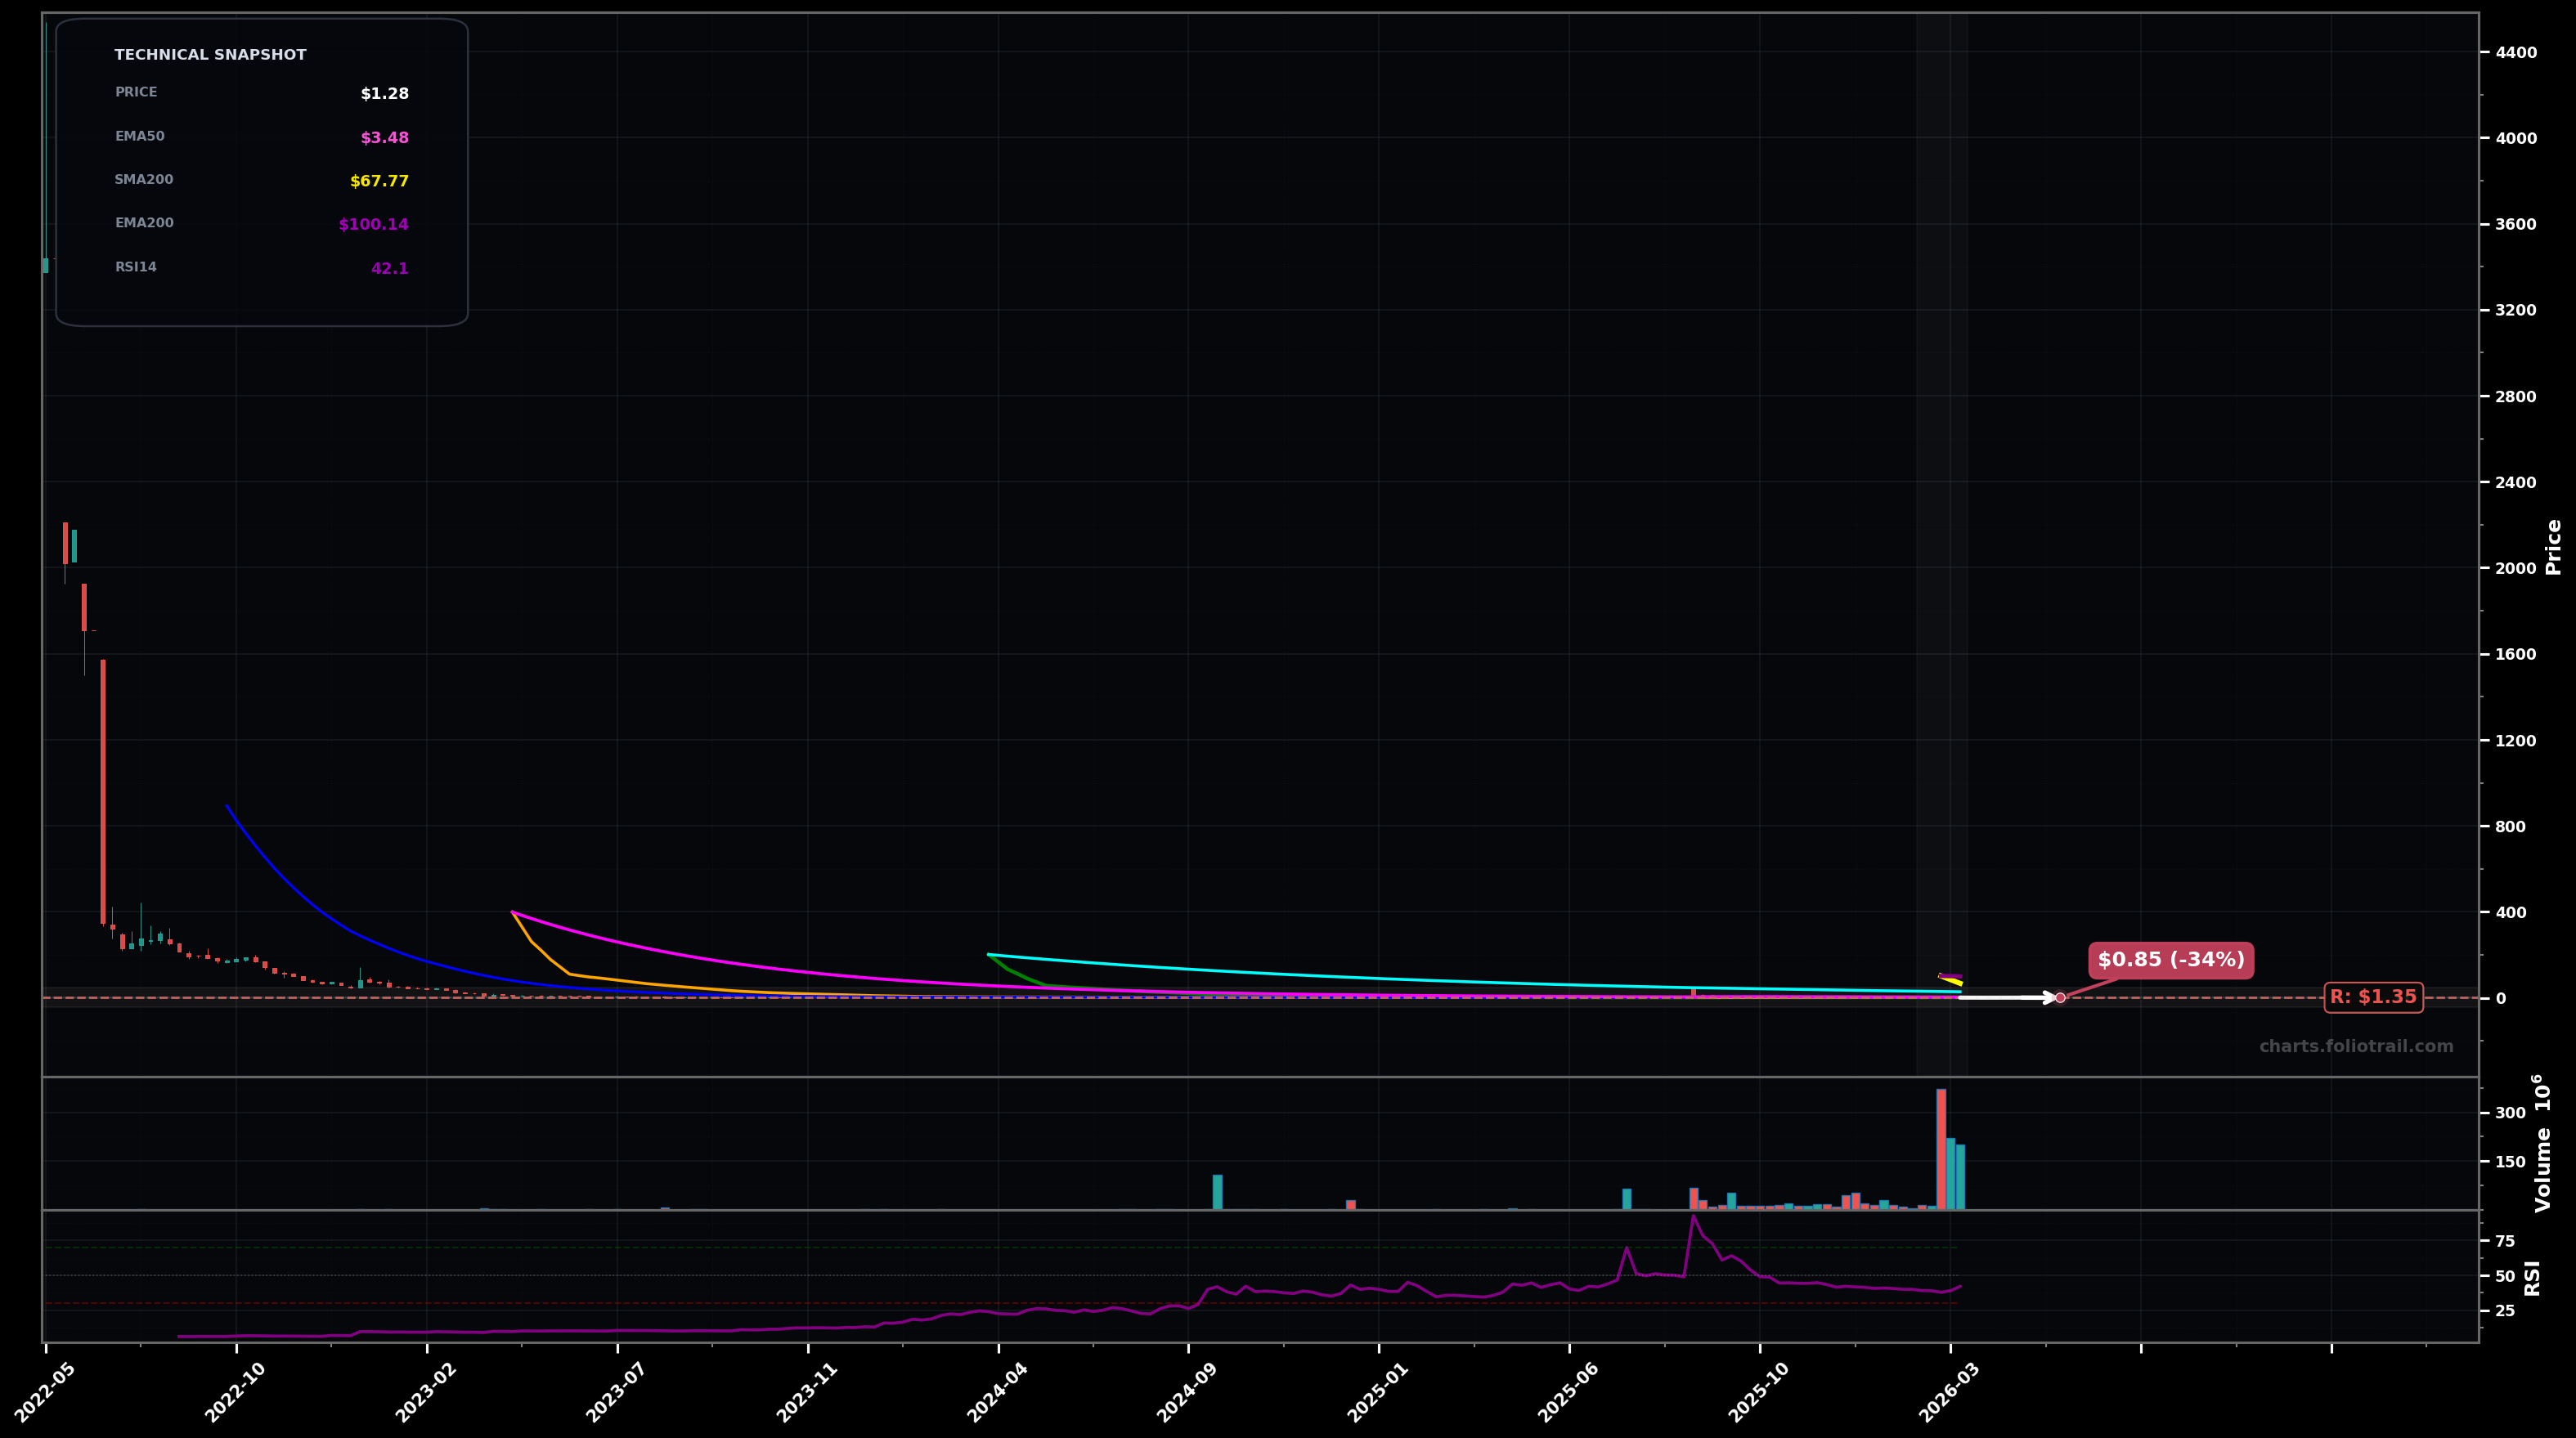
As of March 26, 2026, ORBS (Eightco Holdings Inc.) is in a downtrend state on the weekly chart, with a confidence level of 72%. Key support is at $1.10 and key resistance at $1.35. Weekly price (~$1.28) is grinding sideways-to-lower after a sharp volume spike; still far below major long-term MAs with RSI ~42 (weak momentum).
Base-to-bear continuation: price rejects near $1.35 and drifts down to retest the recent swing-low area; if $1.10 cracks, it seeks a lower liquidity pocket before any meaningful bounce.
Bear-market rally attempt: price holds $1.10 and builds a higher low; a push through $1.35 triggers a squeeze toward the first overhead MAs, but likely stalls below EMA50.
Weekly close below $1.10 (with follow-through) would confirm trend continuation to new local lows
Two weekly closes above $3.50 (reclaim EMA50 ~$3.48) would invalidate the current downtrend call
Accumulation only near support/swing-low liquidity ($1.10 then $0.85); heavy add reserved for a capitulation-style flush while trend remains below EMA50/EMA100.
Trim into overhead MA supply (EMA50 ~$3.48 and nearby SMA50 ~$2.91/SMA100 ~$2.43); larger trims/exit if an impulsive bear-market rally overstretches well above the reclaimed short-term MAs.
As of March 26, 2026, ORBS (Eightco Holdings Inc.) is in a downtrend state on the weekly chart with 72% confidence. Weekly price (~$1.28) is grinding sideways-to-lower after a sharp volume spike; still far below major long-term MAs with RSI ~42 (weak momentum).
On the weekly timeframe, ORBS has key support at $1.10 and key resistance at $1.35. The most likely scenario (bearish) targets $1.10 and $0.85, with a revert level at $1.30.
ORBS (Eightco Holdings Inc.) is currently classified as downtrend on the weekly chart, with 72% confidence. Confirmation requires: Weekly close below $1.10 (with follow-through) would confirm trend continuation to new local lows This would be invalidated by: Two weekly closes above $3.50 (reclaim EMA50 ~$3.48) would invalidate the current downtrend call
The most likely scenario (bearish) targets $1.10 and $0.85, with a revert level at $1.30. The alternative scenario (bullish) targets $1.60 and $2.40.
Multi-layer AI agents analyse 200+ stocks across daily, weekly, and monthly timeframes — producing market state classifications, price scenarios with targets, and position entry/exit levels. Updated every trading day after market close. No paywall. No sign-up required.
Built by Foliotrail.
All content on this website — including charts, analysis, price targets, support/resistance levels, and position zones — is generated entirely by AI and provided for educational and informational purposes only.
This is not financial advice. NEXUSNOIR VENTURES SL (the operator of this website) is not a registered investment adviser or broker-dealer. You should not make investment decisions based solely on this information. Always do your own research and consult a qualified financial advisor.
By continuing, you acknowledge that you have read and agree to our full disclaimer & terms of use and privacy policy.