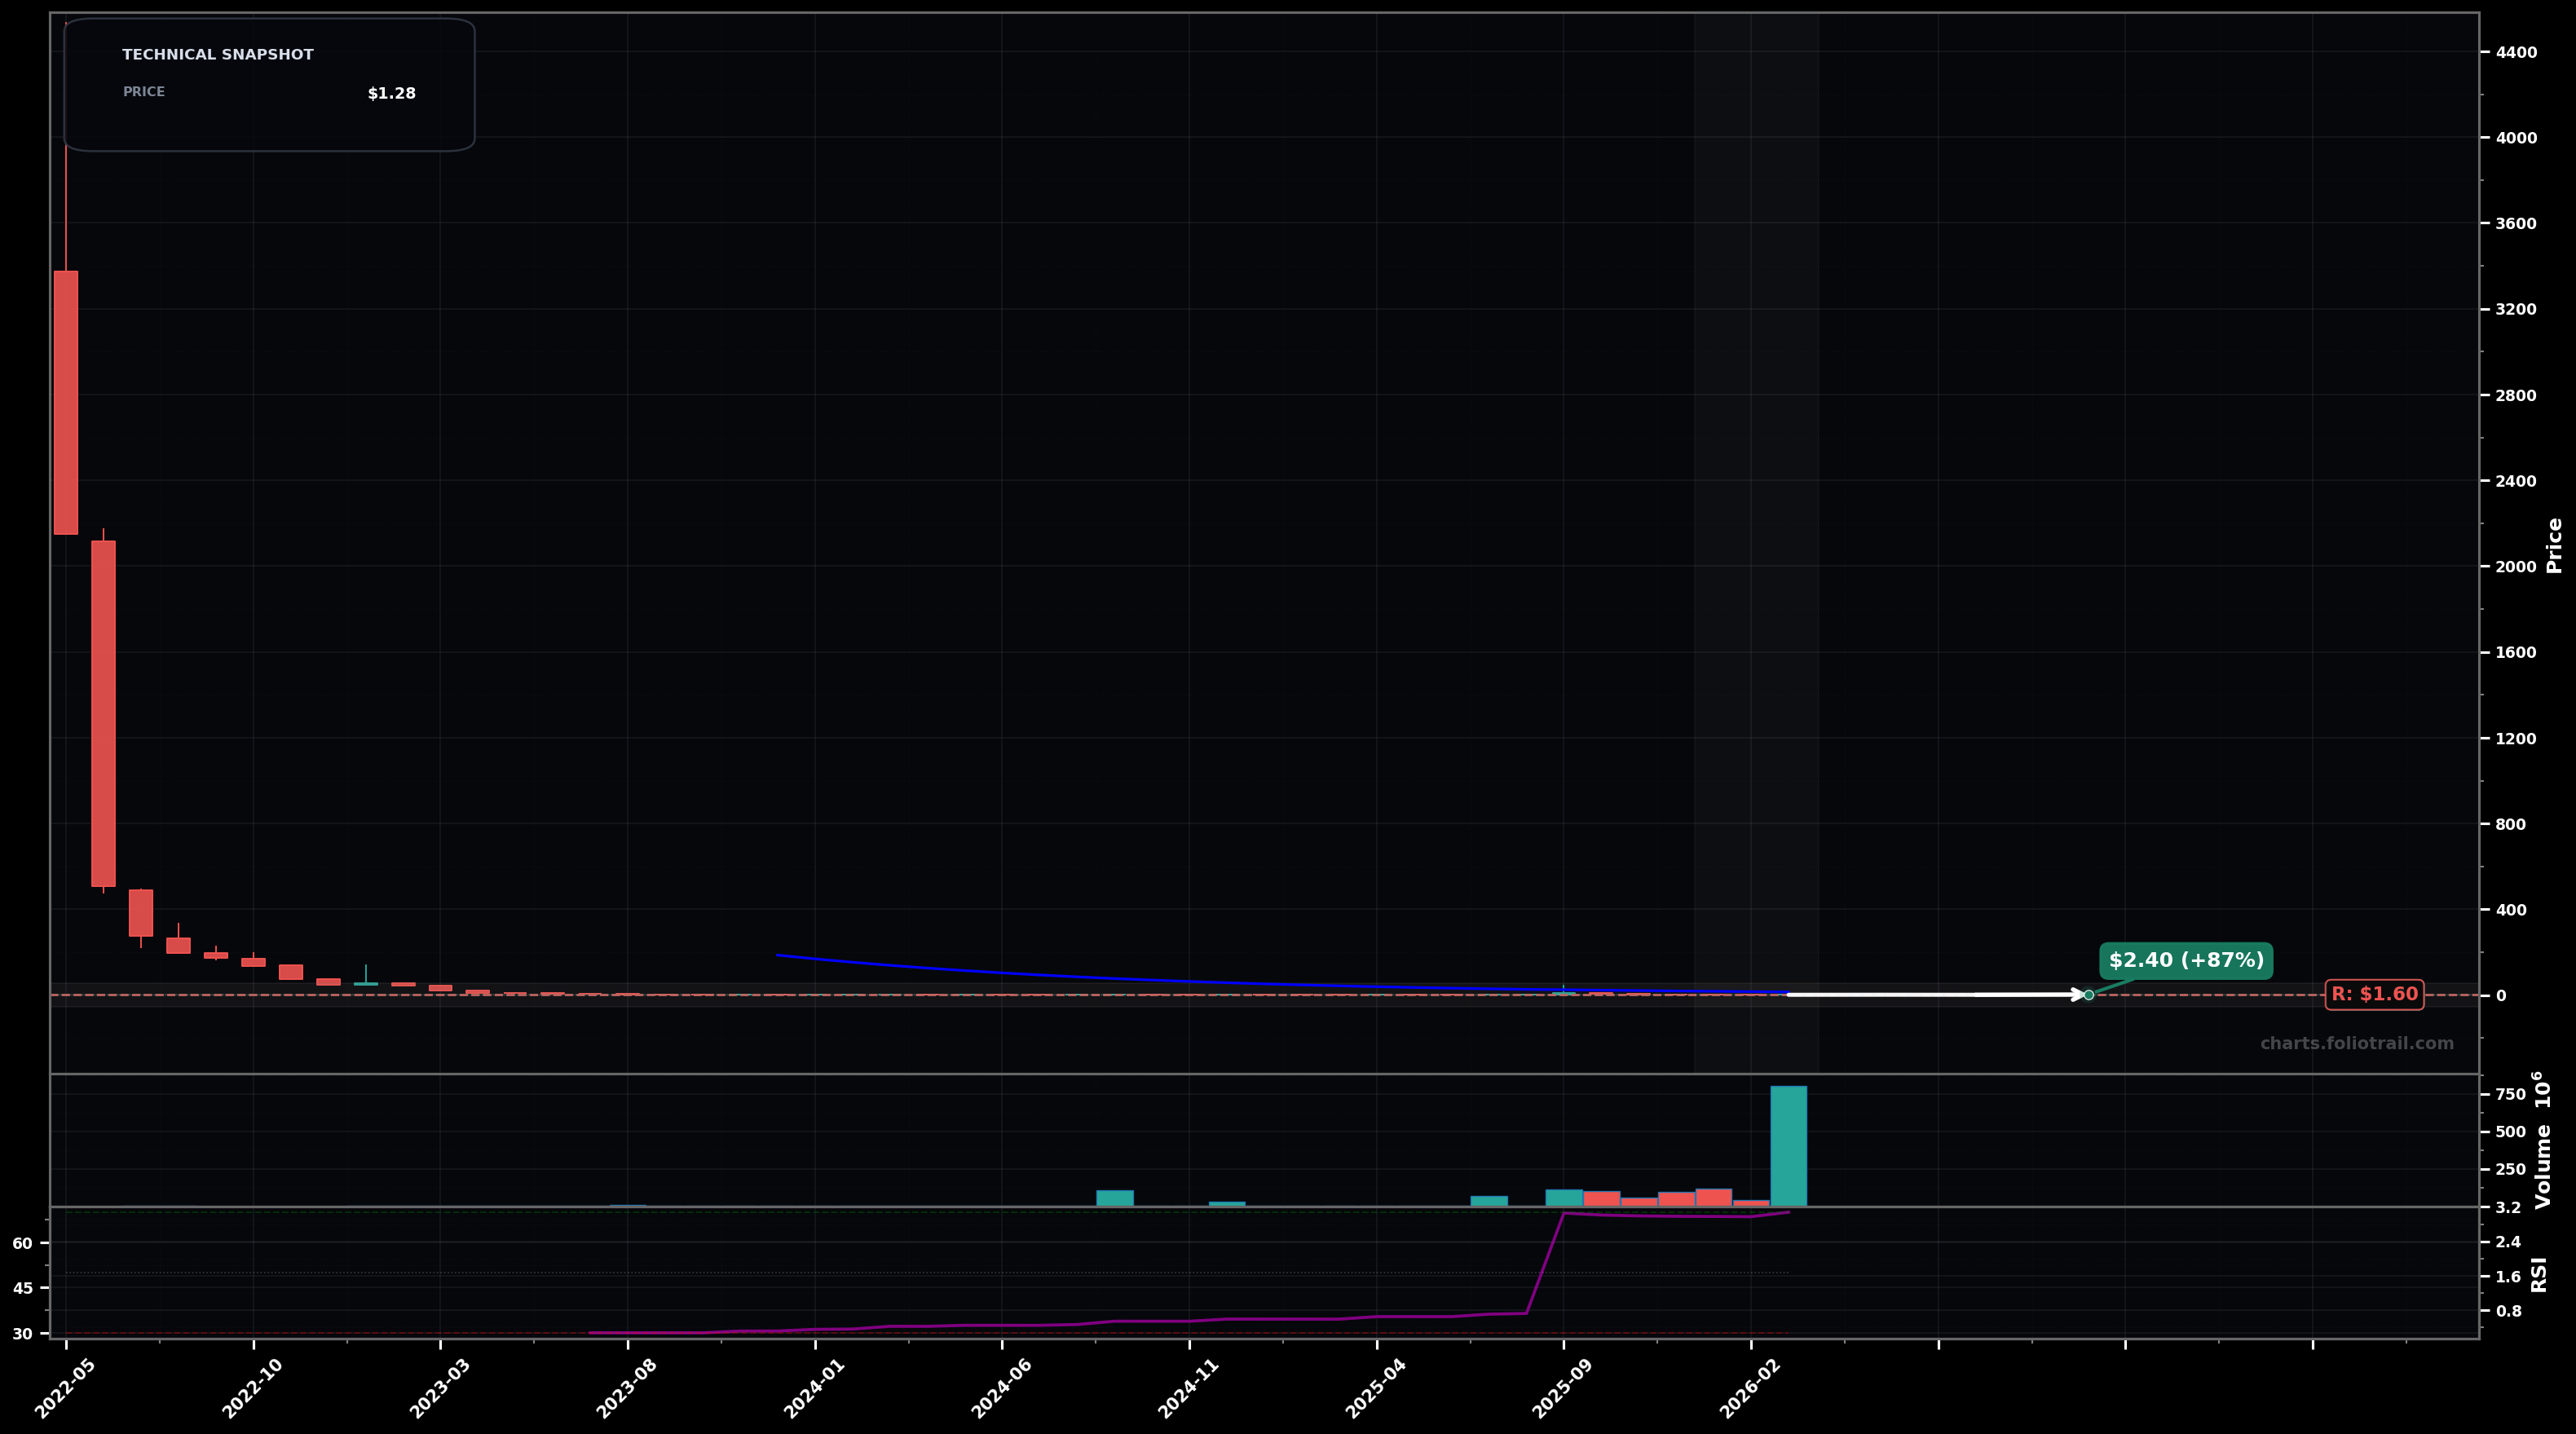
As of March 26, 2026, ORBS (Eightco Holdings Inc.) is in a bottoming attempt state on the monthly chart, with a confidence level of 62%. Key support is at $1.00 and key resistance at $1.60. Multi-year collapse from prior highs, then long flat base; latest month shows a strong green volume spike but price still near the floor around $1.28.
Base continues and ORBS grinds higher; a breakout over the near-term range triggers a mean-reversion move toward the first overhead supply zone (likely the prior distribution shelf) before stalling.
Breakout attempt fails; price revisits base support and may undercut it (liquidity sweep) before any sustainable reversal.
Monthly close above $1.60 and then another close holding above $1.60 (2 consecutive holds)
Monthly close below $1.00
Monthly base support sits near ~$1; scale in on support tests/undercut-and-rally attempts, with heavier adds only if price flushes into deeper capitulation support.
Trims staged into overhead supply/likely Fibonacci retracement zones from the macro decline; higher zones imply increasingly stretched mean-reversion vs long-term trend.
As of March 26, 2026, ORBS (Eightco Holdings Inc.) is in a bottoming attempt state on the monthly chart with 62% confidence. Multi-year collapse from prior highs, then long flat base; latest month shows a strong green volume spike but price still near the floor around $1.28.
On the monthly timeframe, ORBS has key support at $1.00 and key resistance at $1.60. The most likely scenario (bullish) targets $1.60 and $2.40, with a revert level at $1.35.
ORBS (Eightco Holdings Inc.) is currently classified as bottoming attempt on the monthly chart, with 62% confidence. Confirmation requires: Monthly close above $1.60 and then another close holding above $1.60 (2 consecutive holds) This would be invalidated by: Monthly close below $1.00
The most likely scenario (bullish) targets $1.60 and $2.40, with a revert level at $1.35. The alternative scenario (bearish) targets $1.00 and $0.75.
Multi-layer AI agents analyse 200+ stocks across daily, weekly, and monthly timeframes — producing market state classifications, price scenarios with targets, and position entry/exit levels. Updated every trading day after market close. No paywall. No sign-up required.
Built by Foliotrail.
All content on this website — including charts, analysis, price targets, support/resistance levels, and position zones — is generated entirely by AI and provided for educational and informational purposes only.
This is not financial advice. NEXUSNOIR VENTURES SL (the operator of this website) is not a registered investment adviser or broker-dealer. You should not make investment decisions based solely on this information. Always do your own research and consult a qualified financial advisor.
By continuing, you acknowledge that you have read and agree to our full disclaimer & terms of use and privacy policy.