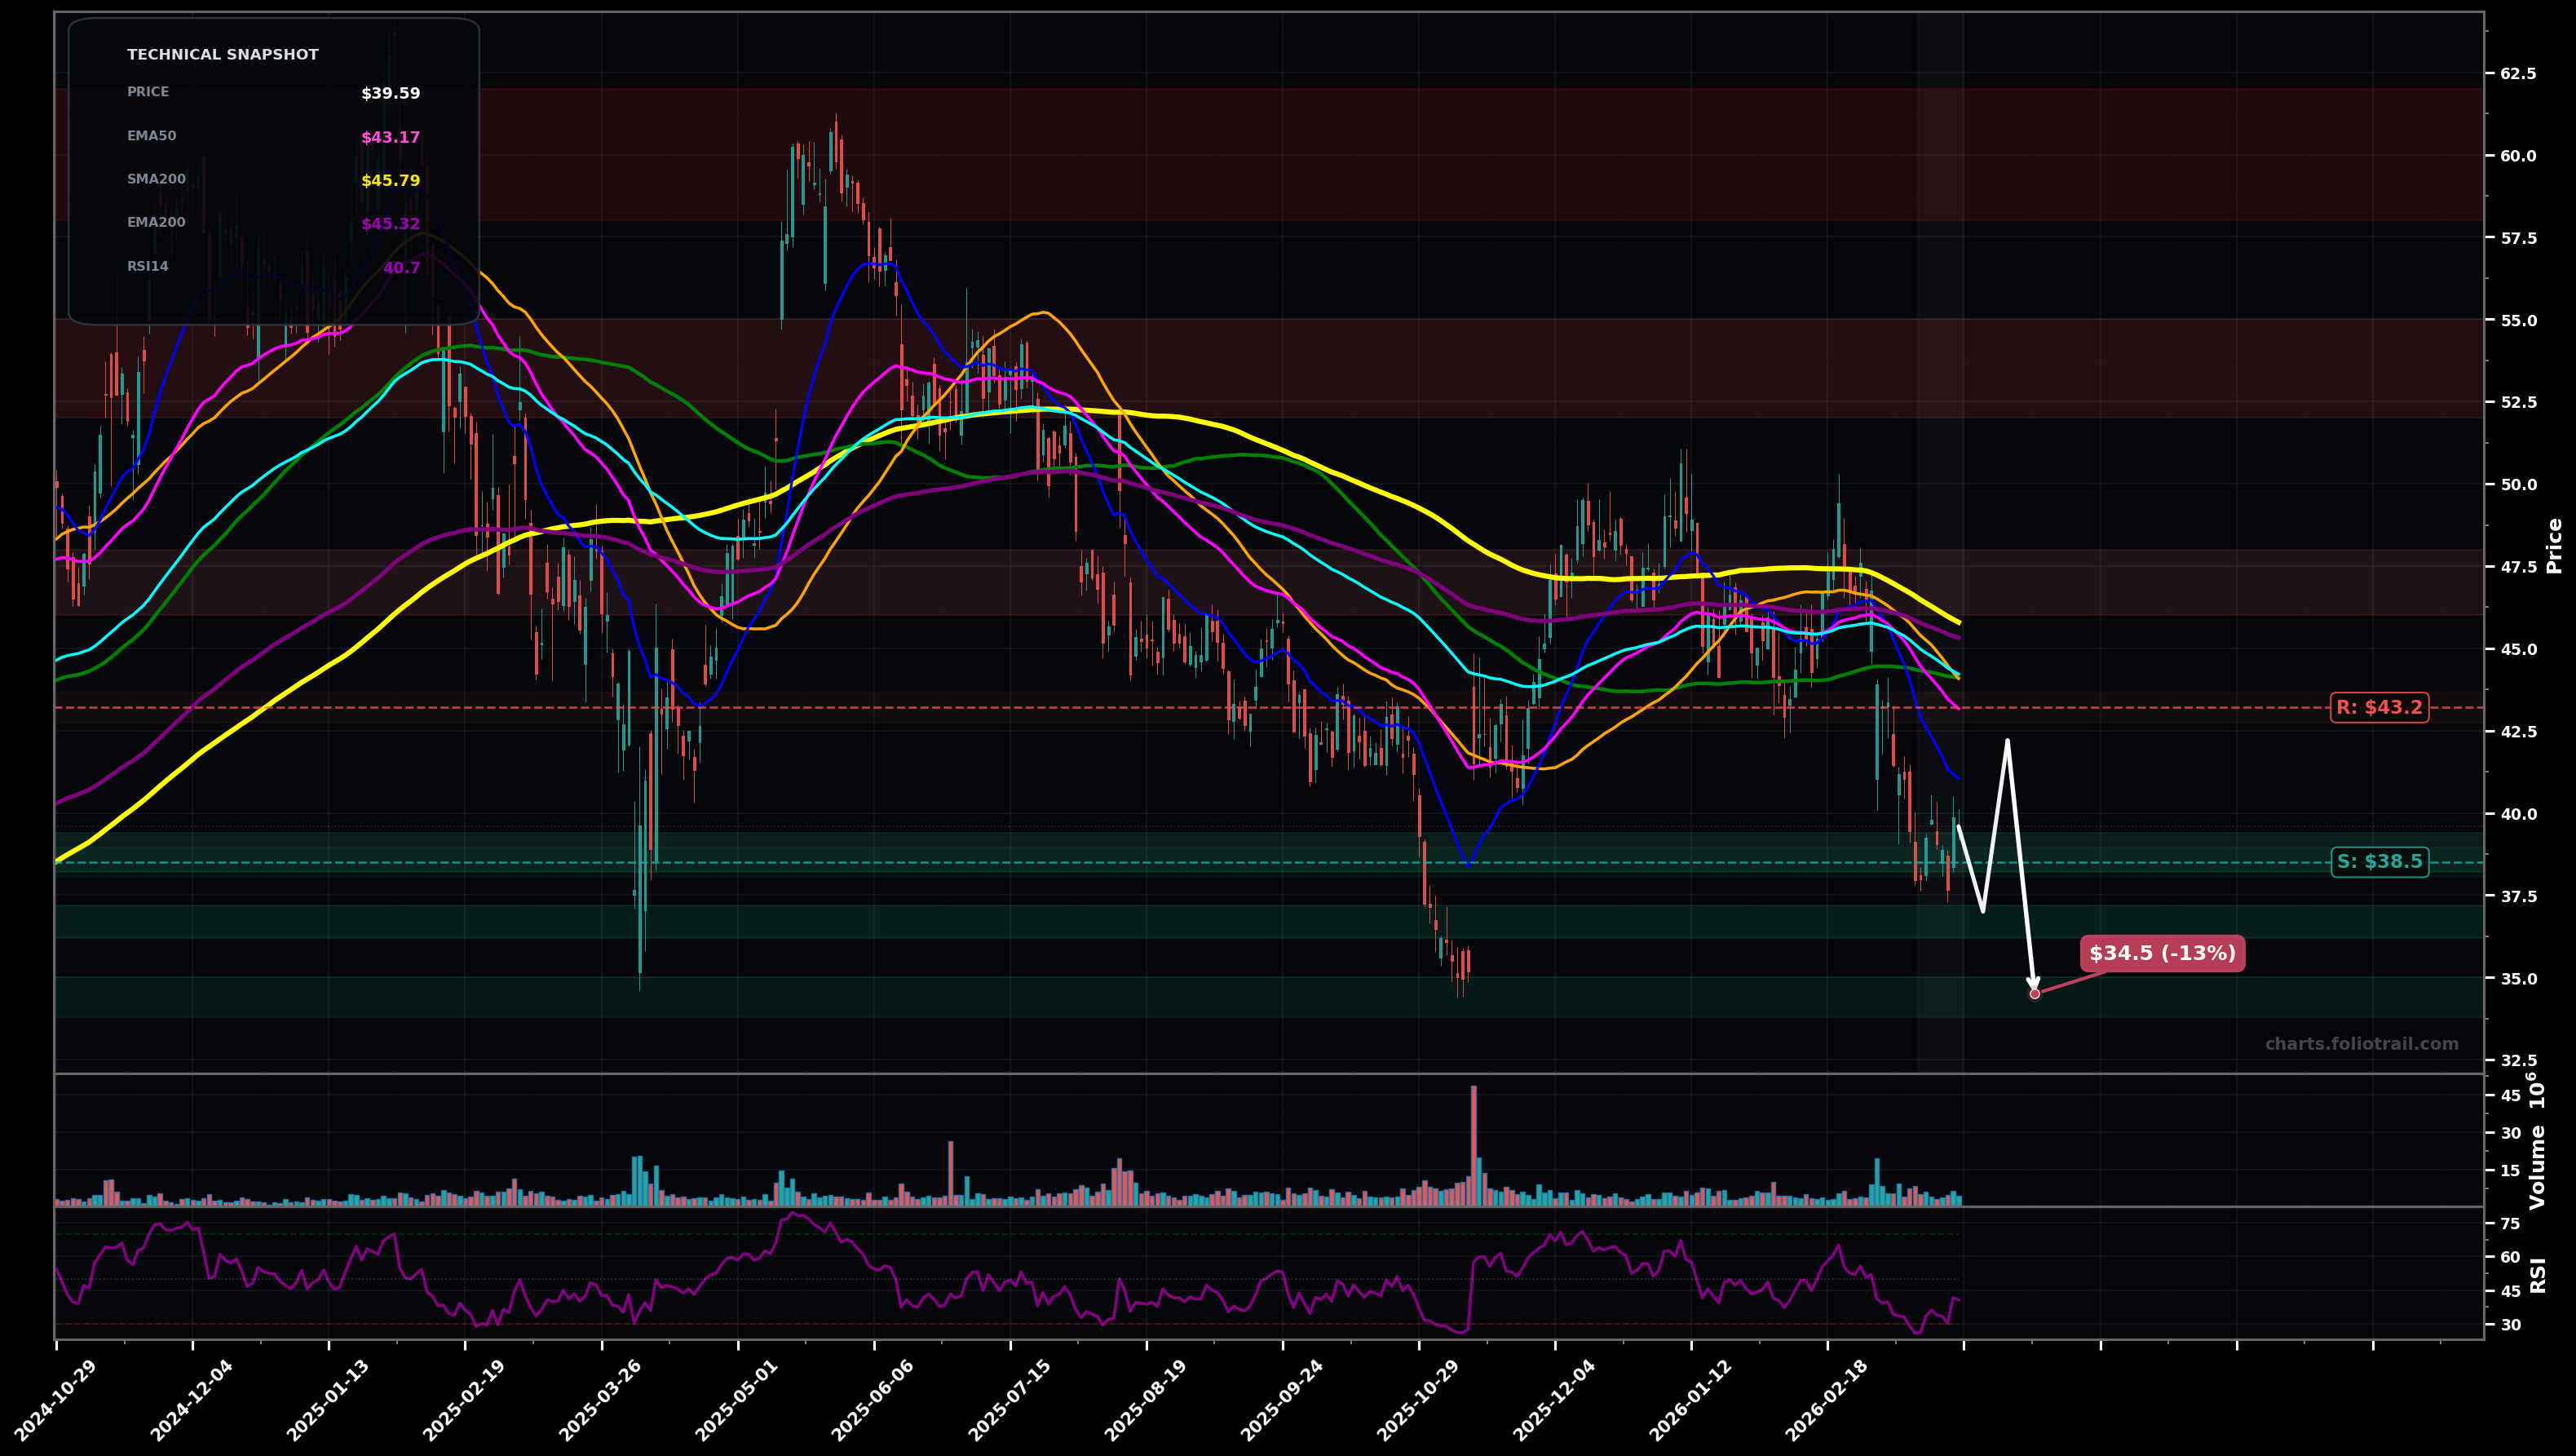
As of March 25, 2026, ONON (On Holding AG) is in a downtrend state on the daily chart, with a confidence level of 78%. Key support is at $38.5 and key resistance at $43.2. Price at $39.59 is below EMA50 ($43.17) and EMA100 ($44.22) with a fresh selloff into the prior $38-$40 demand area; RSI(14) ~40.7 = weak momentum, bounce attempts still corrective.
Bearish continuation: a weak rebound into $41.50-$43.20 gets sold, then price retests and likely breaks the $38-$39 shelf, targeting the next demand near the mid-$30s (Fibonacci-style retrace of the last bounce + prior pivot support).
Relief rally / bottoming attempt: price holds $38-$39, forms a higher low, and squeezes back toward the clustered moving averages; rally likely stalls at the first major MA band unless volume expands.
Daily close below $38.00 (break of the current swing-low support zone) confirms downtrend continuation.
Two consecutive daily closes back above $43.20 (reclaim/hold of EMA50) would invalidate the immediate downtrend pressure.
Stage in at current swing support ($38-$39); add on breakdown/flush into next pivot demand ($36-$37); heavy add only near larger support confluence around prior lows/Fib extension in mid-$30s.
Trim into the first major MA/structure resistance ($46-$48); trim more if price mean-reverts to prior distribution highs ($52-$55); close if it reaches the upper prior peak zone ($58-$62) where upside becomes increasingly stretched.
As of March 25, 2026, ONON (On Holding AG) is in a downtrend state on the daily chart with 78% confidence. Price at $39.59 is below EMA50 ($43.17) and EMA100 ($44.22) with a fresh selloff into the prior $38-$40 demand area; RSI(14) ~40.7 = weak momentum, bounce attempts still corrective.
On the daily timeframe, ONON has key support at $38.5 and key resistance at $43.2. The most likely scenario (bearish) targets $37.0 and $34.5, with a revert level at $42.2.
ONON (On Holding AG) is currently classified as downtrend on the daily chart, with 78% confidence. Confirmation requires: Daily close below $38.00 (break of the current swing-low support zone) confirms downtrend continuation. This would be invalidated by: Two consecutive daily closes back above $43.20 (reclaim/hold of EMA50) would invalidate the immediate downtrend pressure.
The most likely scenario (bearish) targets $37.0 and $34.5, with a revert level at $42.2. The alternative scenario (bullish) targets $43.2 and $46.0.
Multi-layer AI agents analyse 200+ stocks across daily, weekly, and monthly timeframes — producing market state classifications, price scenarios with targets, and position entry/exit levels. Updated every trading day after market close. No paywall. No sign-up required.
Built by Foliotrail.
All content on this website — including charts, analysis, price targets, support/resistance levels, and position zones — is generated entirely by AI and provided for educational and informational purposes only.
This is not financial advice. NEXUSNOIR VENTURES SL (the operator of this website) is not a registered investment adviser or broker-dealer. You should not make investment decisions based solely on this information. Always do your own research and consult a qualified financial advisor.
By continuing, you acknowledge that you have read and agree to our full disclaimer & terms of use and privacy policy.