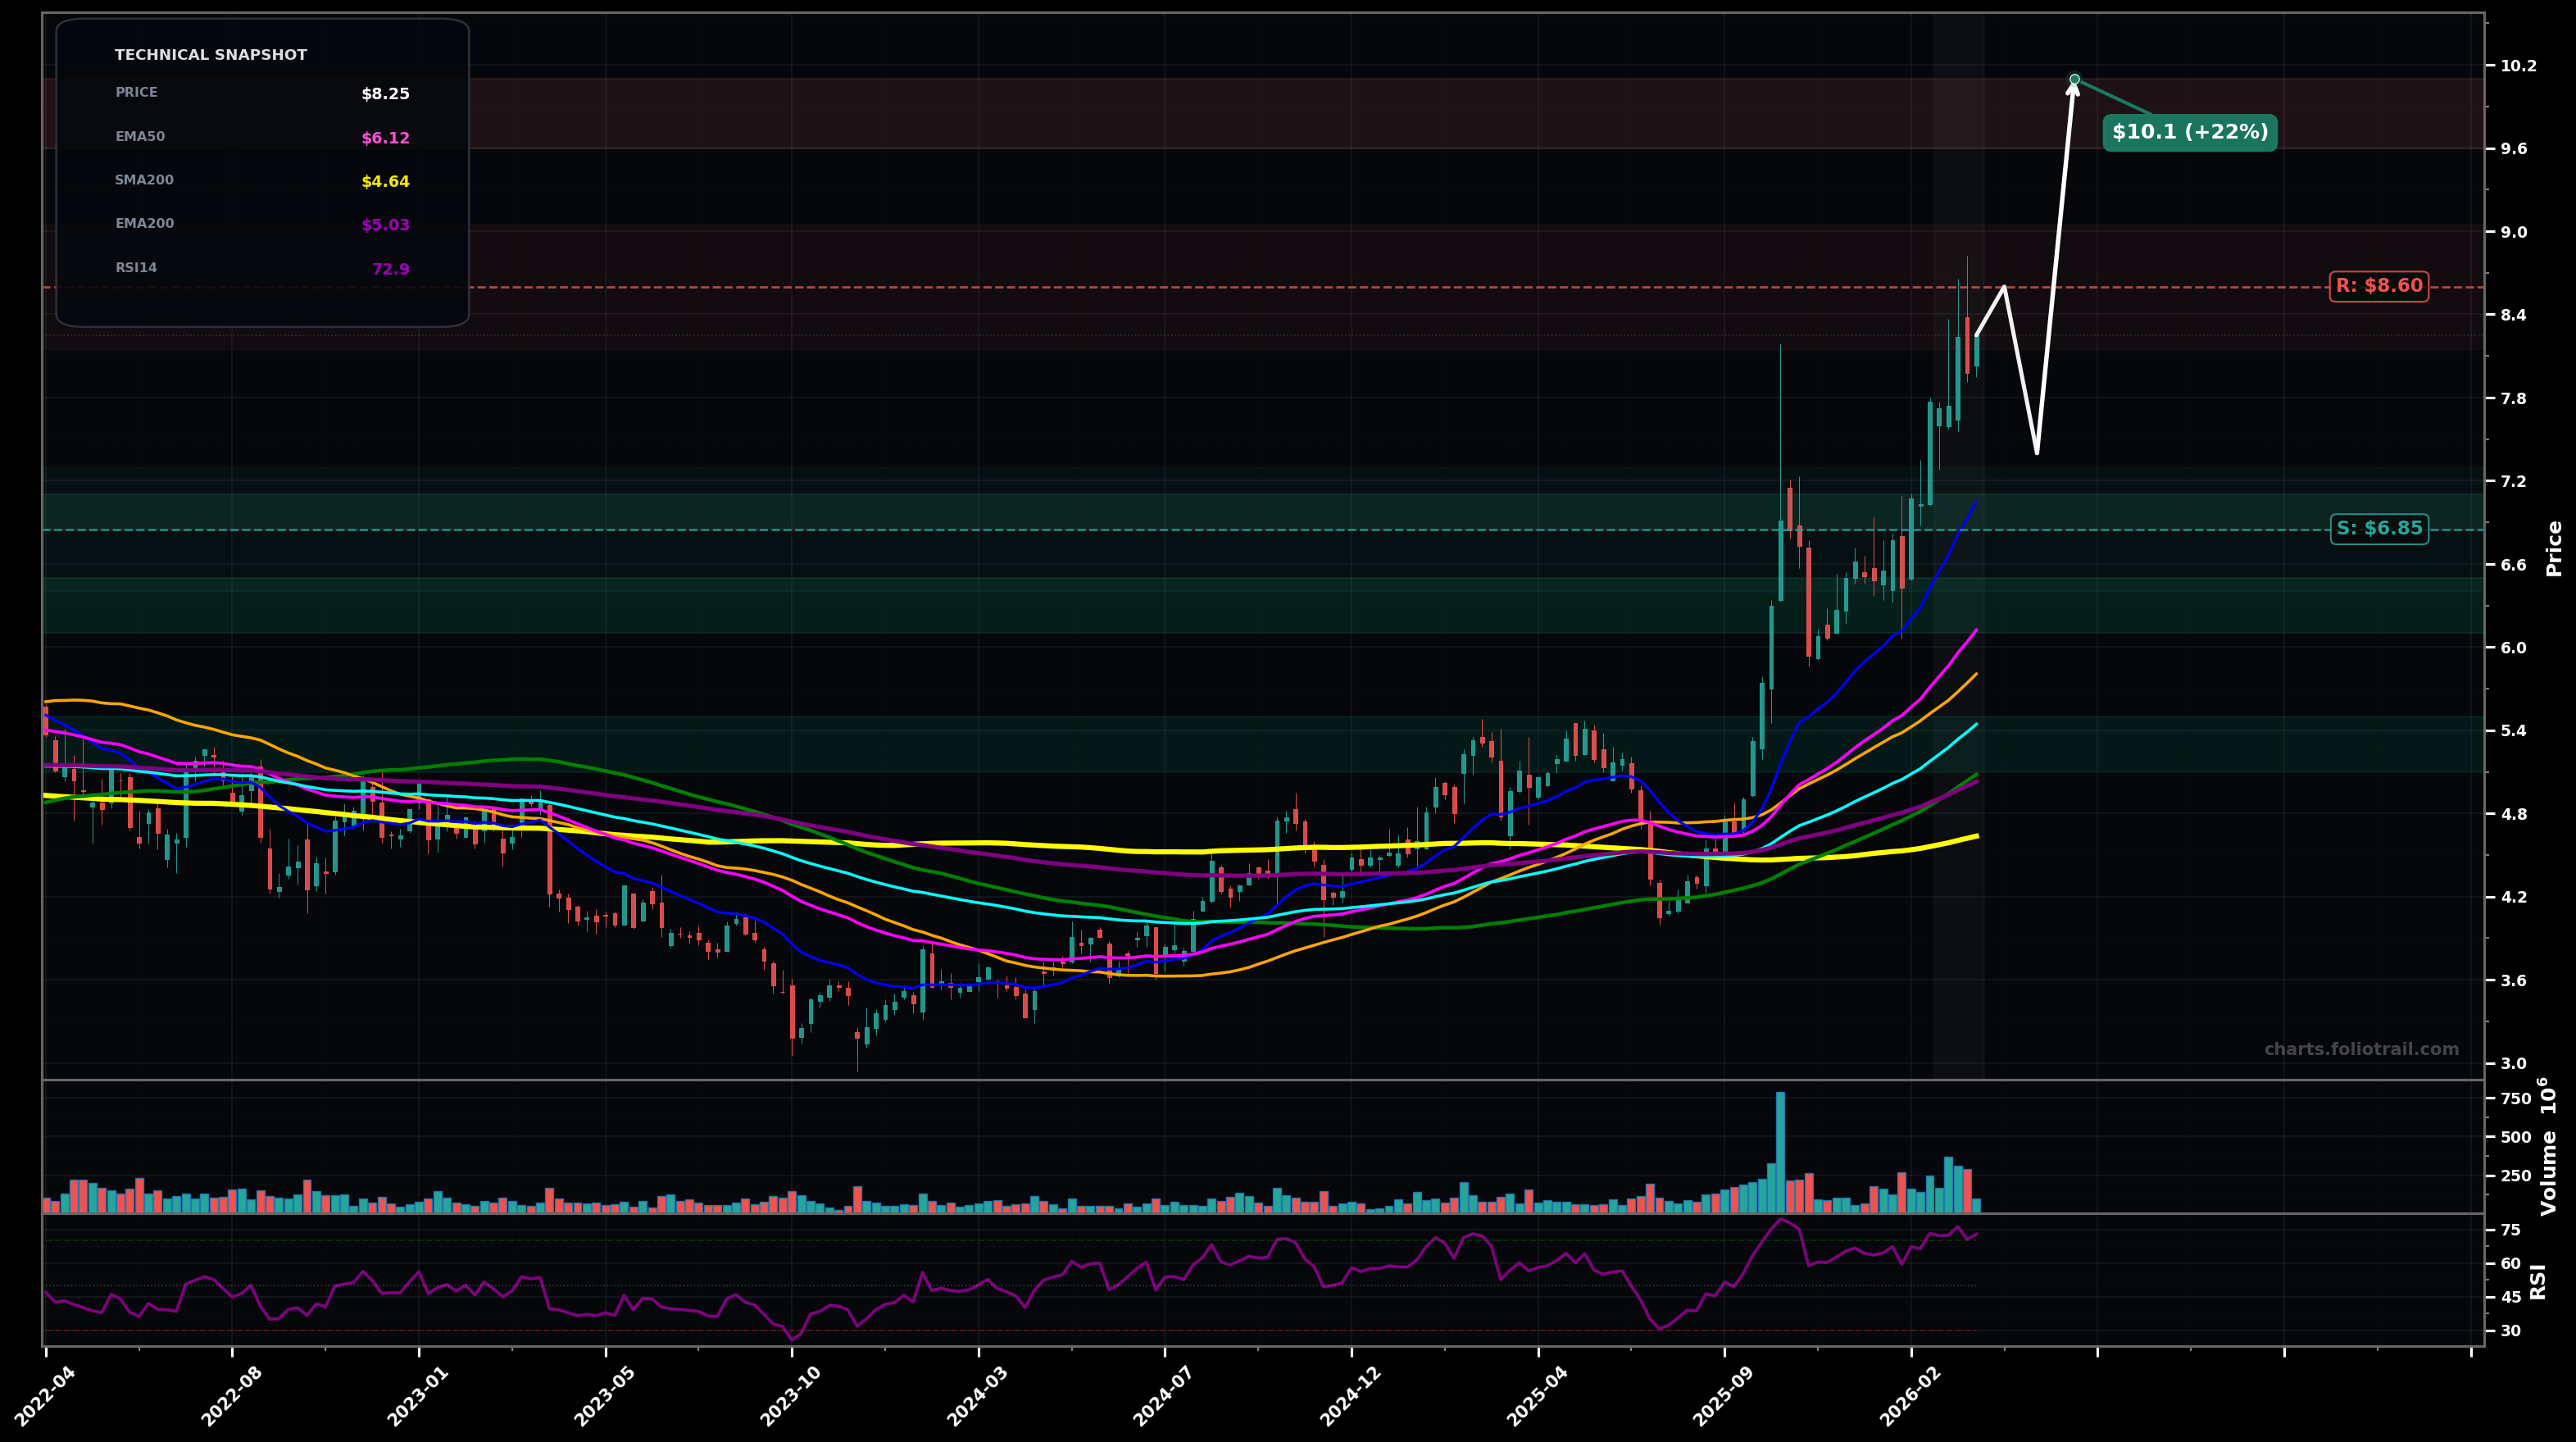
As of March 25, 2026, NOK (Nokia Corporation Sponsored ADR) is in a uptrend state on the weekly chart, with a confidence level of 74%. Key support is at $6.85 and key resistance at $8.60. Strong impulsive rally with HH/HL; price ~$8.25 pulled back slightly after a breakout spike and remains well above rising EMA50/EMA100 with RSI elevated (~72.9).
Bullish continuation: pullback/flag holds above ~$6.85 then price resumes the impulse (Elliott: wave 3 likely in progress; current chop = wave 4 micro), targeting the next Fibonacci extension zone from the ~$4.10→~$8.55 impulse.
Deeper correction: momentum mean-reverts after RSI>70; price revisits the breakout/MA cluster (EMA50/EMA20) and may retrace ~38.2%-50% of the latest impulse before attempting a new high (Elliott: larger wave 4).
Weekly close above $8.60 with follow-through (next week holding >$8.60).
Weekly close below $6.85 (loss of post-breakout swing support and EMA20/EMA50 area).
Entries laddered at post-breakout swing support (~$6.85), then EMA50/structure retrace (~$6.1), then EMA100/EMA200 + prior base area (~$5.1-$5.5) if a larger wave-4 correction plays out.
Trim into Fibonacci extension/round-number zones above prior highs where price is likely to be stretched vs rising EMA50/EMA100; progressively heavier derisking as extensions stack and mean-reversion risk rises.
As of March 25, 2026, NOK (Nokia Corporation Sponsored ADR) is in a uptrend state on the weekly chart with 74% confidence. Strong impulsive rally with HH/HL; price ~$8.25 pulled back slightly after a breakout spike and remains well above rising EMA50/EMA100 with RSI elevated (~72.9).
On the weekly timeframe, NOK has key support at $6.85 and key resistance at $8.60. The most likely scenario (bullish) targets $8.60 and $10.1, with a revert level at $7.40.
NOK (Nokia Corporation Sponsored ADR) is currently classified as uptrend on the weekly chart, with 74% confidence. Confirmation requires: Weekly close above $8.60 with follow-through (next week holding >$8.60). This would be invalidated by: Weekly close below $6.85 (loss of post-breakout swing support and EMA20/EMA50 area).
The most likely scenario (bullish) targets $8.60 and $10.1, with a revert level at $7.40. The alternative scenario (bearish) targets $7.00 and $6.10.
Multi-layer AI agents analyse 200+ stocks across daily, weekly, and monthly timeframes — producing market state classifications, price scenarios with targets, and position entry/exit levels. Updated every trading day after market close. No paywall. No sign-up required.
Built by Foliotrail.
All content on this website — including charts, analysis, price targets, support/resistance levels, and position zones — is generated entirely by AI and provided for educational and informational purposes only.
This is not financial advice. NEXUSNOIR VENTURES SL (the operator of this website) is not a registered investment adviser or broker-dealer. You should not make investment decisions based solely on this information. Always do your own research and consult a qualified financial advisor.
By continuing, you acknowledge that you have read and agree to our full disclaimer & terms of use and privacy policy.