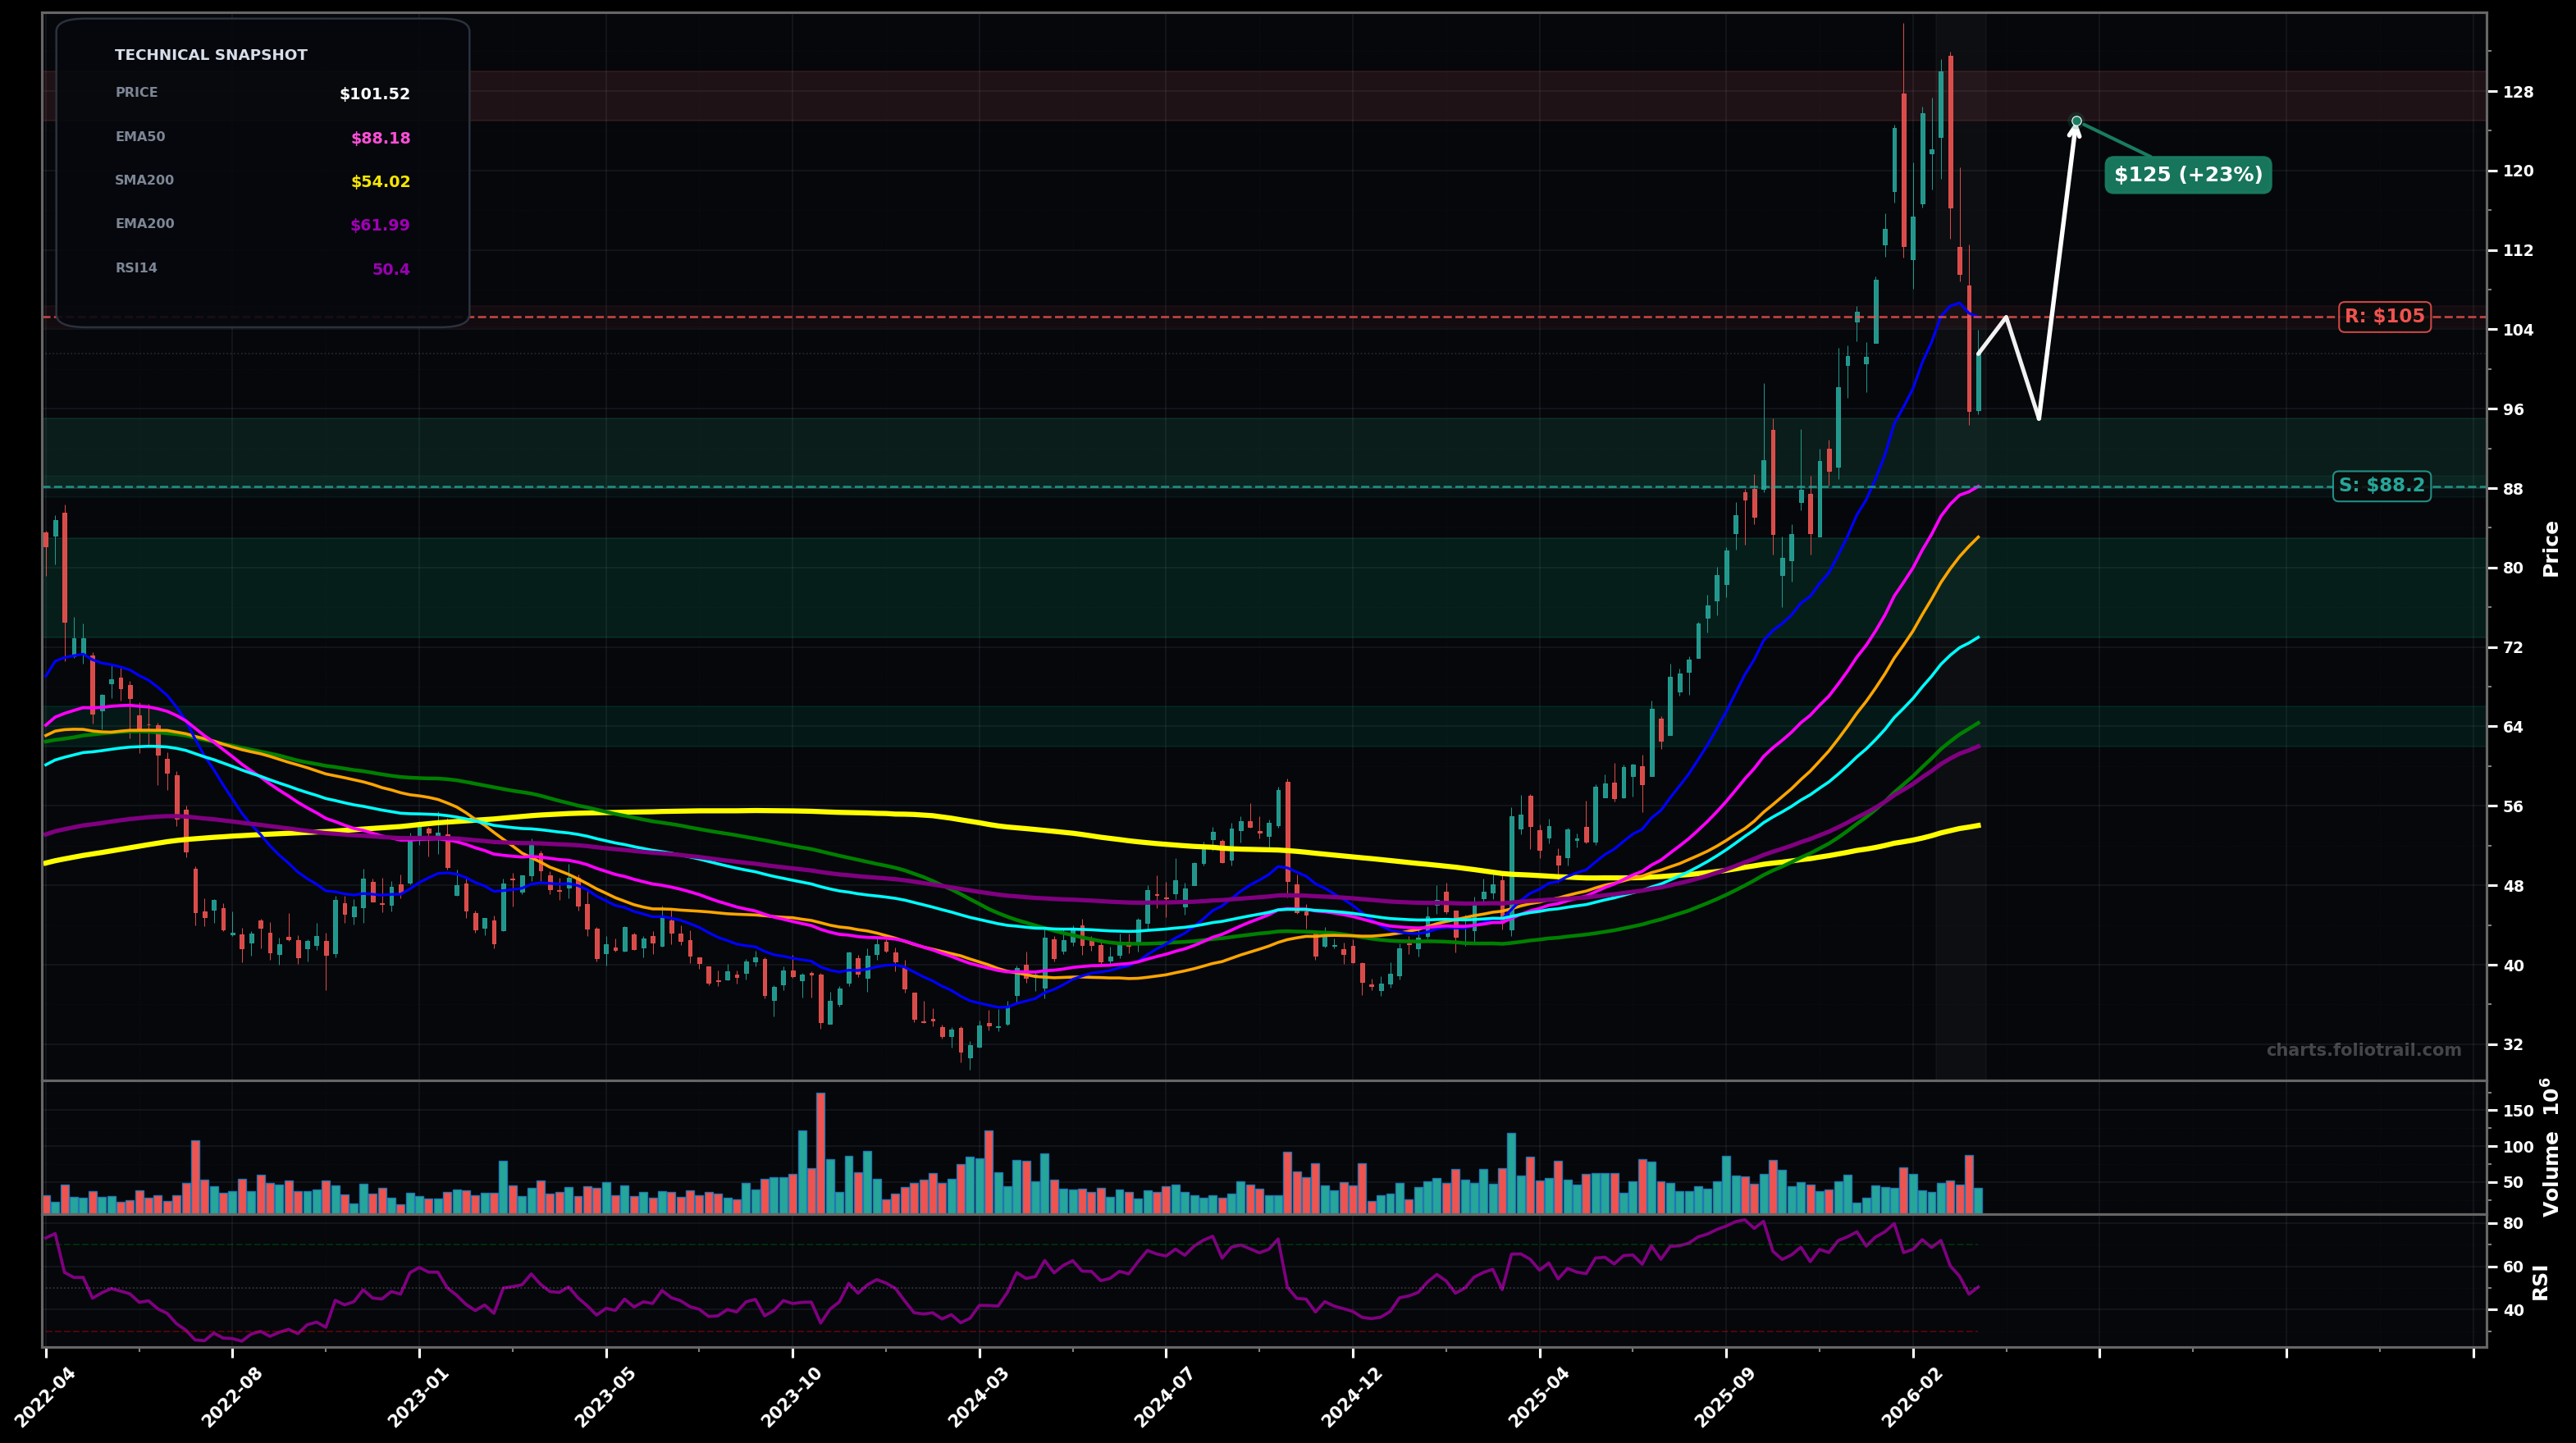
As of March 26, 2026, NEM (Newmont Corporation) is in a volatility expansion state on the weekly chart, with a confidence level of 68%. Key support is at $88.2 and key resistance at $105. Sharp pullback from the $125-$130 blow-off area into ~$101, still above rising EMA50/EMA100; RSI reset to ~50.
Bullish consolidation then continuation: price holds the EMA50 area, forms a higher low, and grinds back above the EMA20 to retest the prior supply zone.
Deeper ABC correction: failure to reclaim ~$105 leads to another leg down into the EMA50/50SMA cluster, with a possible wick toward EMA100 before buyers step back in.
Sustained reclaim/hold above $105 (2 weekly closes) would confirm stabilization after the volatility burst
Weekly close below $88 would invalidate the post-run support and shift bias to a deeper correction
Buy-the-dip ladder around dynamic supports: EMA50/SMA50 cluster ($88-$95), then EMA100+SMA100 area ($73-$83), then EMA200/SMA200 band (~$62-$66) if a full mean-reversion occurs.
Trim into prior blow-off high ($125-$130) and any extension well above rising EMA50; heavier trims if price enters a renewed impulsive Wave-5 style extension (Fibo-style 1.272–1.618 of the last major swing), with full exit reserved for an extreme multi-year overshoot.
As of March 26, 2026, NEM (Newmont Corporation) is in a volatility expansion state on the weekly chart with 68% confidence. Sharp pullback from the $125-$130 blow-off area into ~$101, still above rising EMA50/EMA100; RSI reset to ~50.
On the weekly timeframe, NEM has key support at $88.2 and key resistance at $105. The most likely scenario (bullish) targets $105 and $125, with a revert level at $95.0.
NEM (Newmont Corporation) is currently classified as volatility expansion on the weekly chart, with 68% confidence. Confirmation requires: Sustained reclaim/hold above $105 (2 weekly closes) would confirm stabilization after the volatility burst This would be invalidated by: Weekly close below $88 would invalidate the post-run support and shift bias to a deeper correction
The most likely scenario (bullish) targets $105 and $125, with a revert level at $95.0. The alternative scenario (bearish) targets $88.0 and $73.0.
Multi-layer AI agents analyse 200+ stocks across daily, weekly, and monthly timeframes — producing market state classifications, price scenarios with targets, and position entry/exit levels. Updated every trading day after market close. No paywall. No sign-up required.
Built by Foliotrail.
All content on this website — including charts, analysis, price targets, support/resistance levels, and position zones — is generated entirely by AI and provided for educational and informational purposes only.
This is not financial advice. NEXUSNOIR VENTURES SL (the operator of this website) is not a registered investment adviser or broker-dealer. You should not make investment decisions based solely on this information. Always do your own research and consult a qualified financial advisor.
By continuing, you acknowledge that you have read and agree to our full disclaimer & terms of use and privacy policy.