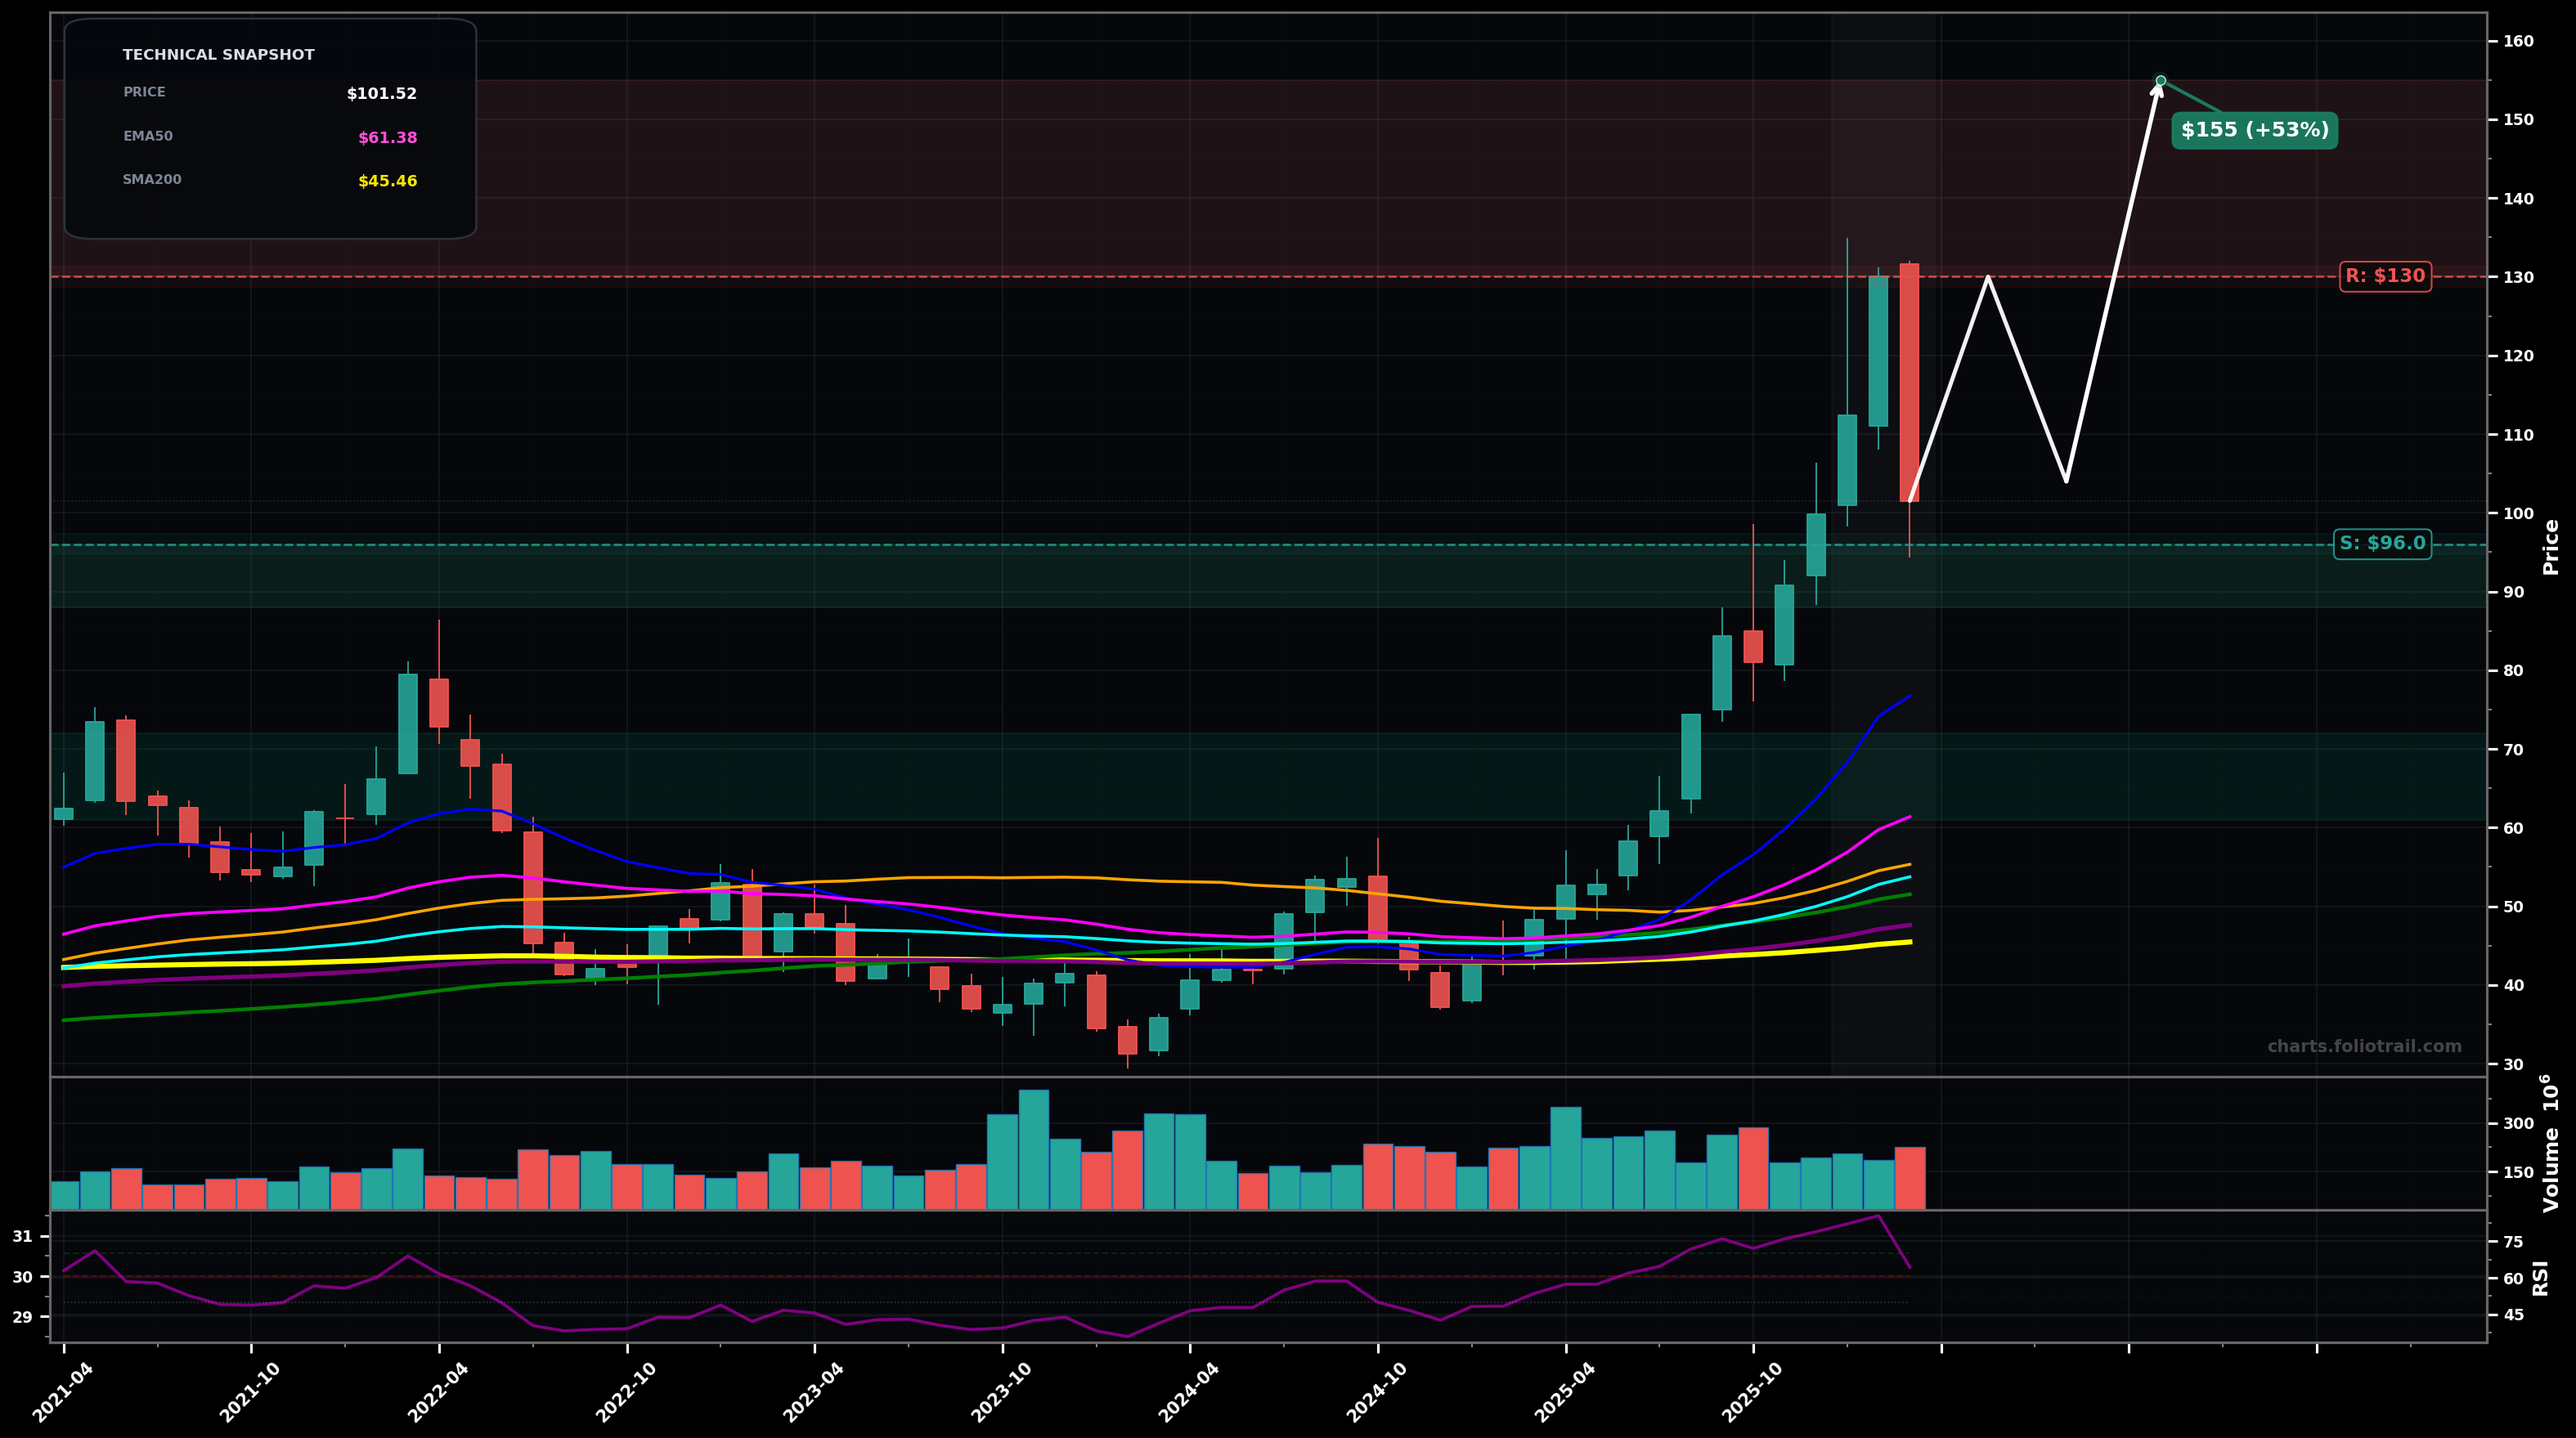
As of March 26, 2026, NEM (Newmont Corporation) is in a volatility expansion state on the monthly chart, with a confidence level of 74%. Key support is at $96.0 and key resistance at $130. Monthly uptrend had a sharp momentum run to ~$130 followed by a large red pullback candle, still closing well above rising mid/long MAs (EMA50/EMA100/EMA200 and SMA200).
Bullish continuation after a pullback/base: price holds ~$96–$88, then retests the prior swing high and attempts a breakout; fits an Elliott Wave view of a wave (4) pullback before wave (5) attempt.
Deeper mean-reversion: failure to hold ~$96 leads to a drop toward the prior consolidation/MA cluster; this would be consistent with a larger wave (4) or an ABC correction retracing a big part of the impulse leg.
2 monthly closes holding above $96 would confirm volatility expansion resolving upward (trend intact).
Monthly close below $86 would invalidate the immediate bull continuation setup (risk of deeper mean-reversion).
Buy-the-dip framework: $88–$96 is the first swing-support/round-number zone; $72–$86 is the next prior base + likely Fib retrace area; $61–$72 aligns with EMA50 (~$61) and deeper retrace where trend buyers typically defend.
Trim into prior high ($130) and likely Fib extensions above it as price gets increasingly stretched away from EMA50/EMA100; fully exit only if a multi-year extension zone ($185–$220) prints with euphoric candles/failed breakouts.
As of March 26, 2026, NEM (Newmont Corporation) is in a volatility expansion state on the monthly chart with 74% confidence. Monthly uptrend had a sharp momentum run to ~$130 followed by a large red pullback candle, still closing well above rising mid/long MAs (EMA50/EMA100/EMA200 and SMA200).
On the monthly timeframe, NEM has key support at $96.0 and key resistance at $130. The most likely scenario (bullish) targets $130 and $155, with a revert level at $104.
NEM (Newmont Corporation) is currently classified as volatility expansion on the monthly chart, with 74% confidence. Confirmation requires: 2 monthly closes holding above $96 would confirm volatility expansion resolving upward (trend intact). This would be invalidated by: Monthly close below $86 would invalidate the immediate bull continuation setup (risk of deeper mean-reversion).
The most likely scenario (bullish) targets $130 and $155, with a revert level at $104. The alternative scenario (bearish) targets $86.0 and $72.0.
Multi-layer AI agents analyse 200+ stocks across daily, weekly, and monthly timeframes — producing market state classifications, price scenarios with targets, and position entry/exit levels. Updated every trading day after market close. No paywall. No sign-up required.
Built by Foliotrail.
All content on this website — including charts, analysis, price targets, support/resistance levels, and position zones — is generated entirely by AI and provided for educational and informational purposes only.
This is not financial advice. NEXUSNOIR VENTURES SL (the operator of this website) is not a registered investment adviser or broker-dealer. You should not make investment decisions based solely on this information. Always do your own research and consult a qualified financial advisor.
By continuing, you acknowledge that you have read and agree to our full disclaimer & terms of use and privacy policy.