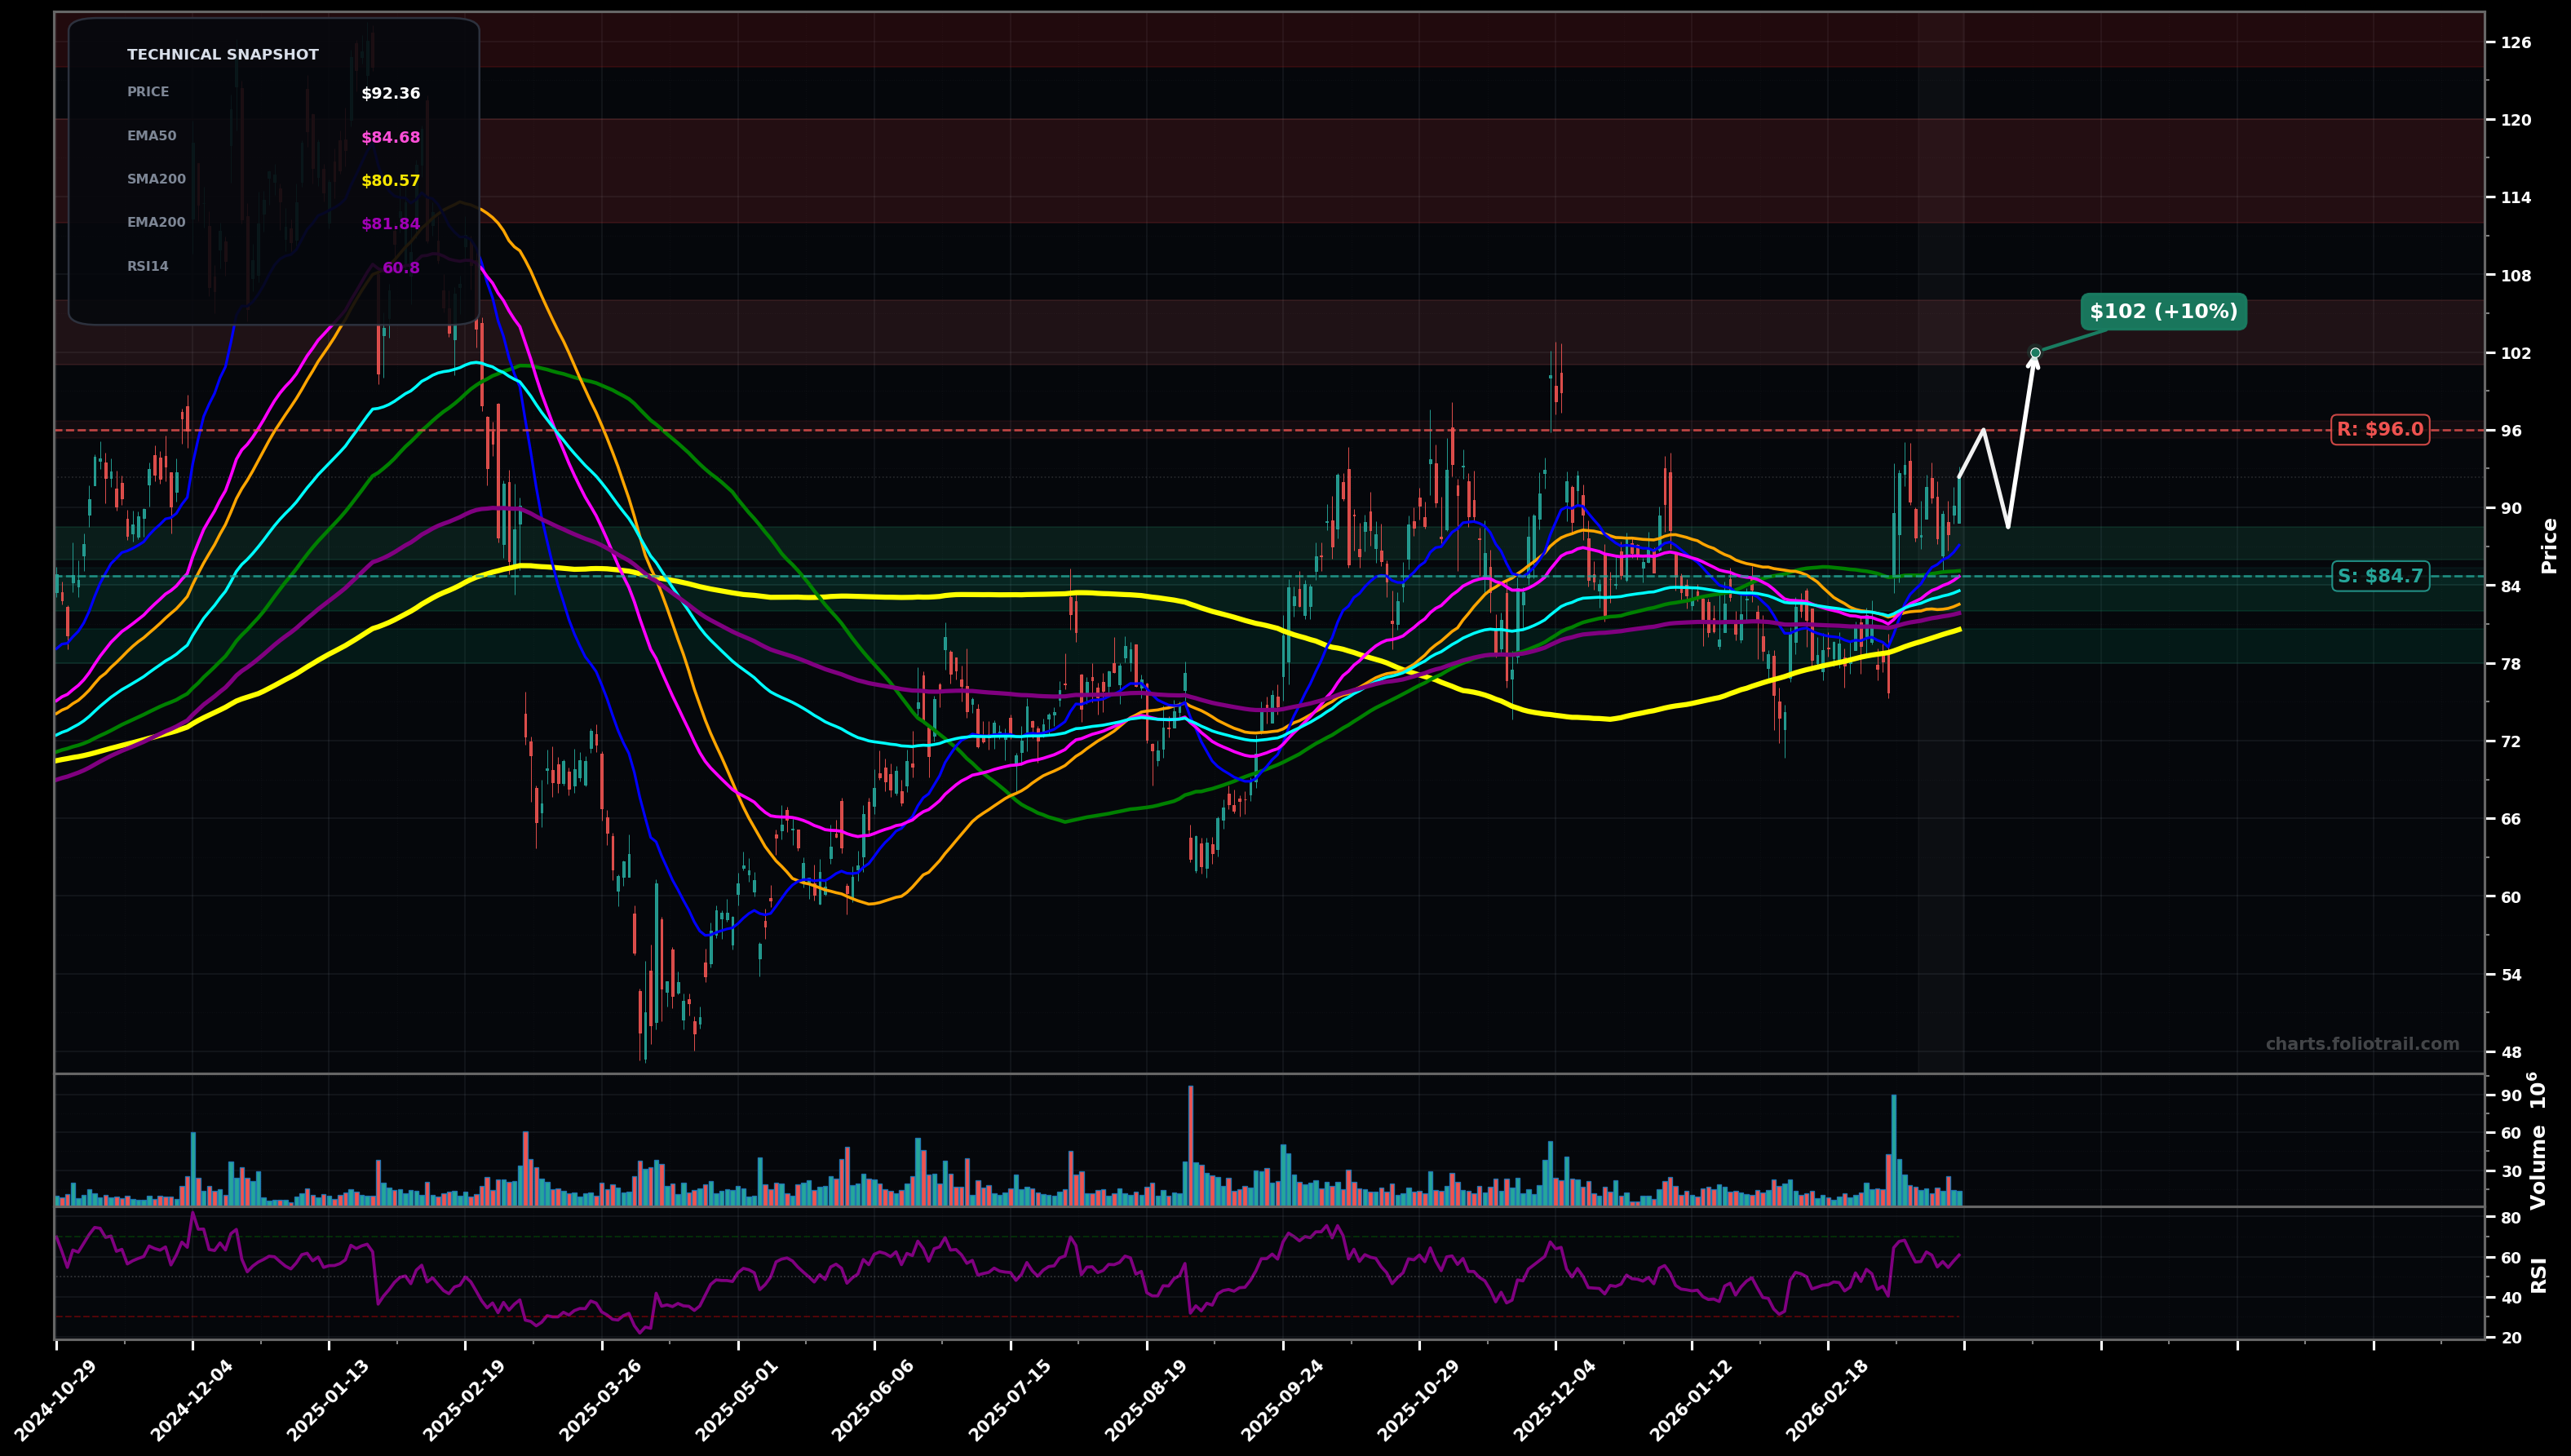
As of March 25, 2026, MRVL (Marvell Technology, Inc.) is in a breakout reversal state on the daily chart, with a confidence level of 63%. Key support is at $84.7 and key resistance at $96.0. Price at ~$92.36 pushed above the clustered short/mid MAs (EMA50/100/200 and SMAs 50/100/200) and is holding in the upper part of the recent range; RSI ~60 suggests improving momentum.
Bullish continuation: price consolidates above reclaimed MAs, then breaks the $96 supply zone and grinds higher (range expansion).
Bearish pullback: breakout fails and MRVL mean-reverts into the MA cluster; a deeper retest of the base occurs before another attempt higher.
2+ daily closes holding above $90.00
Daily close back below $83.50
Buy-the-dip framework around reclaimed EMA50/100 first, then add on a retest of EMA200/SMA200 confluence, heavy add only at the swing-low/base support (~$78–$80.6) if a shakeout occurs.
Trim into prior supply/extension zones: first near the next resistance band (~$102 area), then larger trims if price gets materially stretched above the MA stack; full exit only on a multi-year type extension back toward prior peak-zone ($124+).
As of March 25, 2026, MRVL (Marvell Technology, Inc.) is in a breakout reversal state on the daily chart with 63% confidence. Price at ~$92.36 pushed above the clustered short/mid MAs (EMA50/100/200 and SMAs 50/100/200) and is holding in the upper part of the recent range; RSI ~60 suggests improving momentum.
On the daily timeframe, MRVL has key support at $84.7 and key resistance at $96.0. The most likely scenario (bullish) targets $96.0 and $102, with a revert level at $88.5.
MRVL (Marvell Technology, Inc.) is currently classified as breakout reversal on the daily chart, with 63% confidence. Confirmation requires: 2+ daily closes holding above $90.00 This would be invalidated by: Daily close back below $83.50
The most likely scenario (bullish) targets $96.0 and $102, with a revert level at $88.5. The alternative scenario (bearish) targets $84.7 and $80.6.
Multi-layer AI agents analyse 200+ stocks across daily, weekly, and monthly timeframes — producing market state classifications, price scenarios with targets, and position entry/exit levels. Updated every trading day after market close. No paywall. No sign-up required.
Built by Foliotrail.
All content on this website — including charts, analysis, price targets, support/resistance levels, and position zones — is generated entirely by AI and provided for educational and informational purposes only.
This is not financial advice. NEXUSNOIR VENTURES SL (the operator of this website) is not a registered investment adviser or broker-dealer. You should not make investment decisions based solely on this information. Always do your own research and consult a qualified financial advisor.
By continuing, you acknowledge that you have read and agree to our full disclaimer & terms of use and privacy policy.