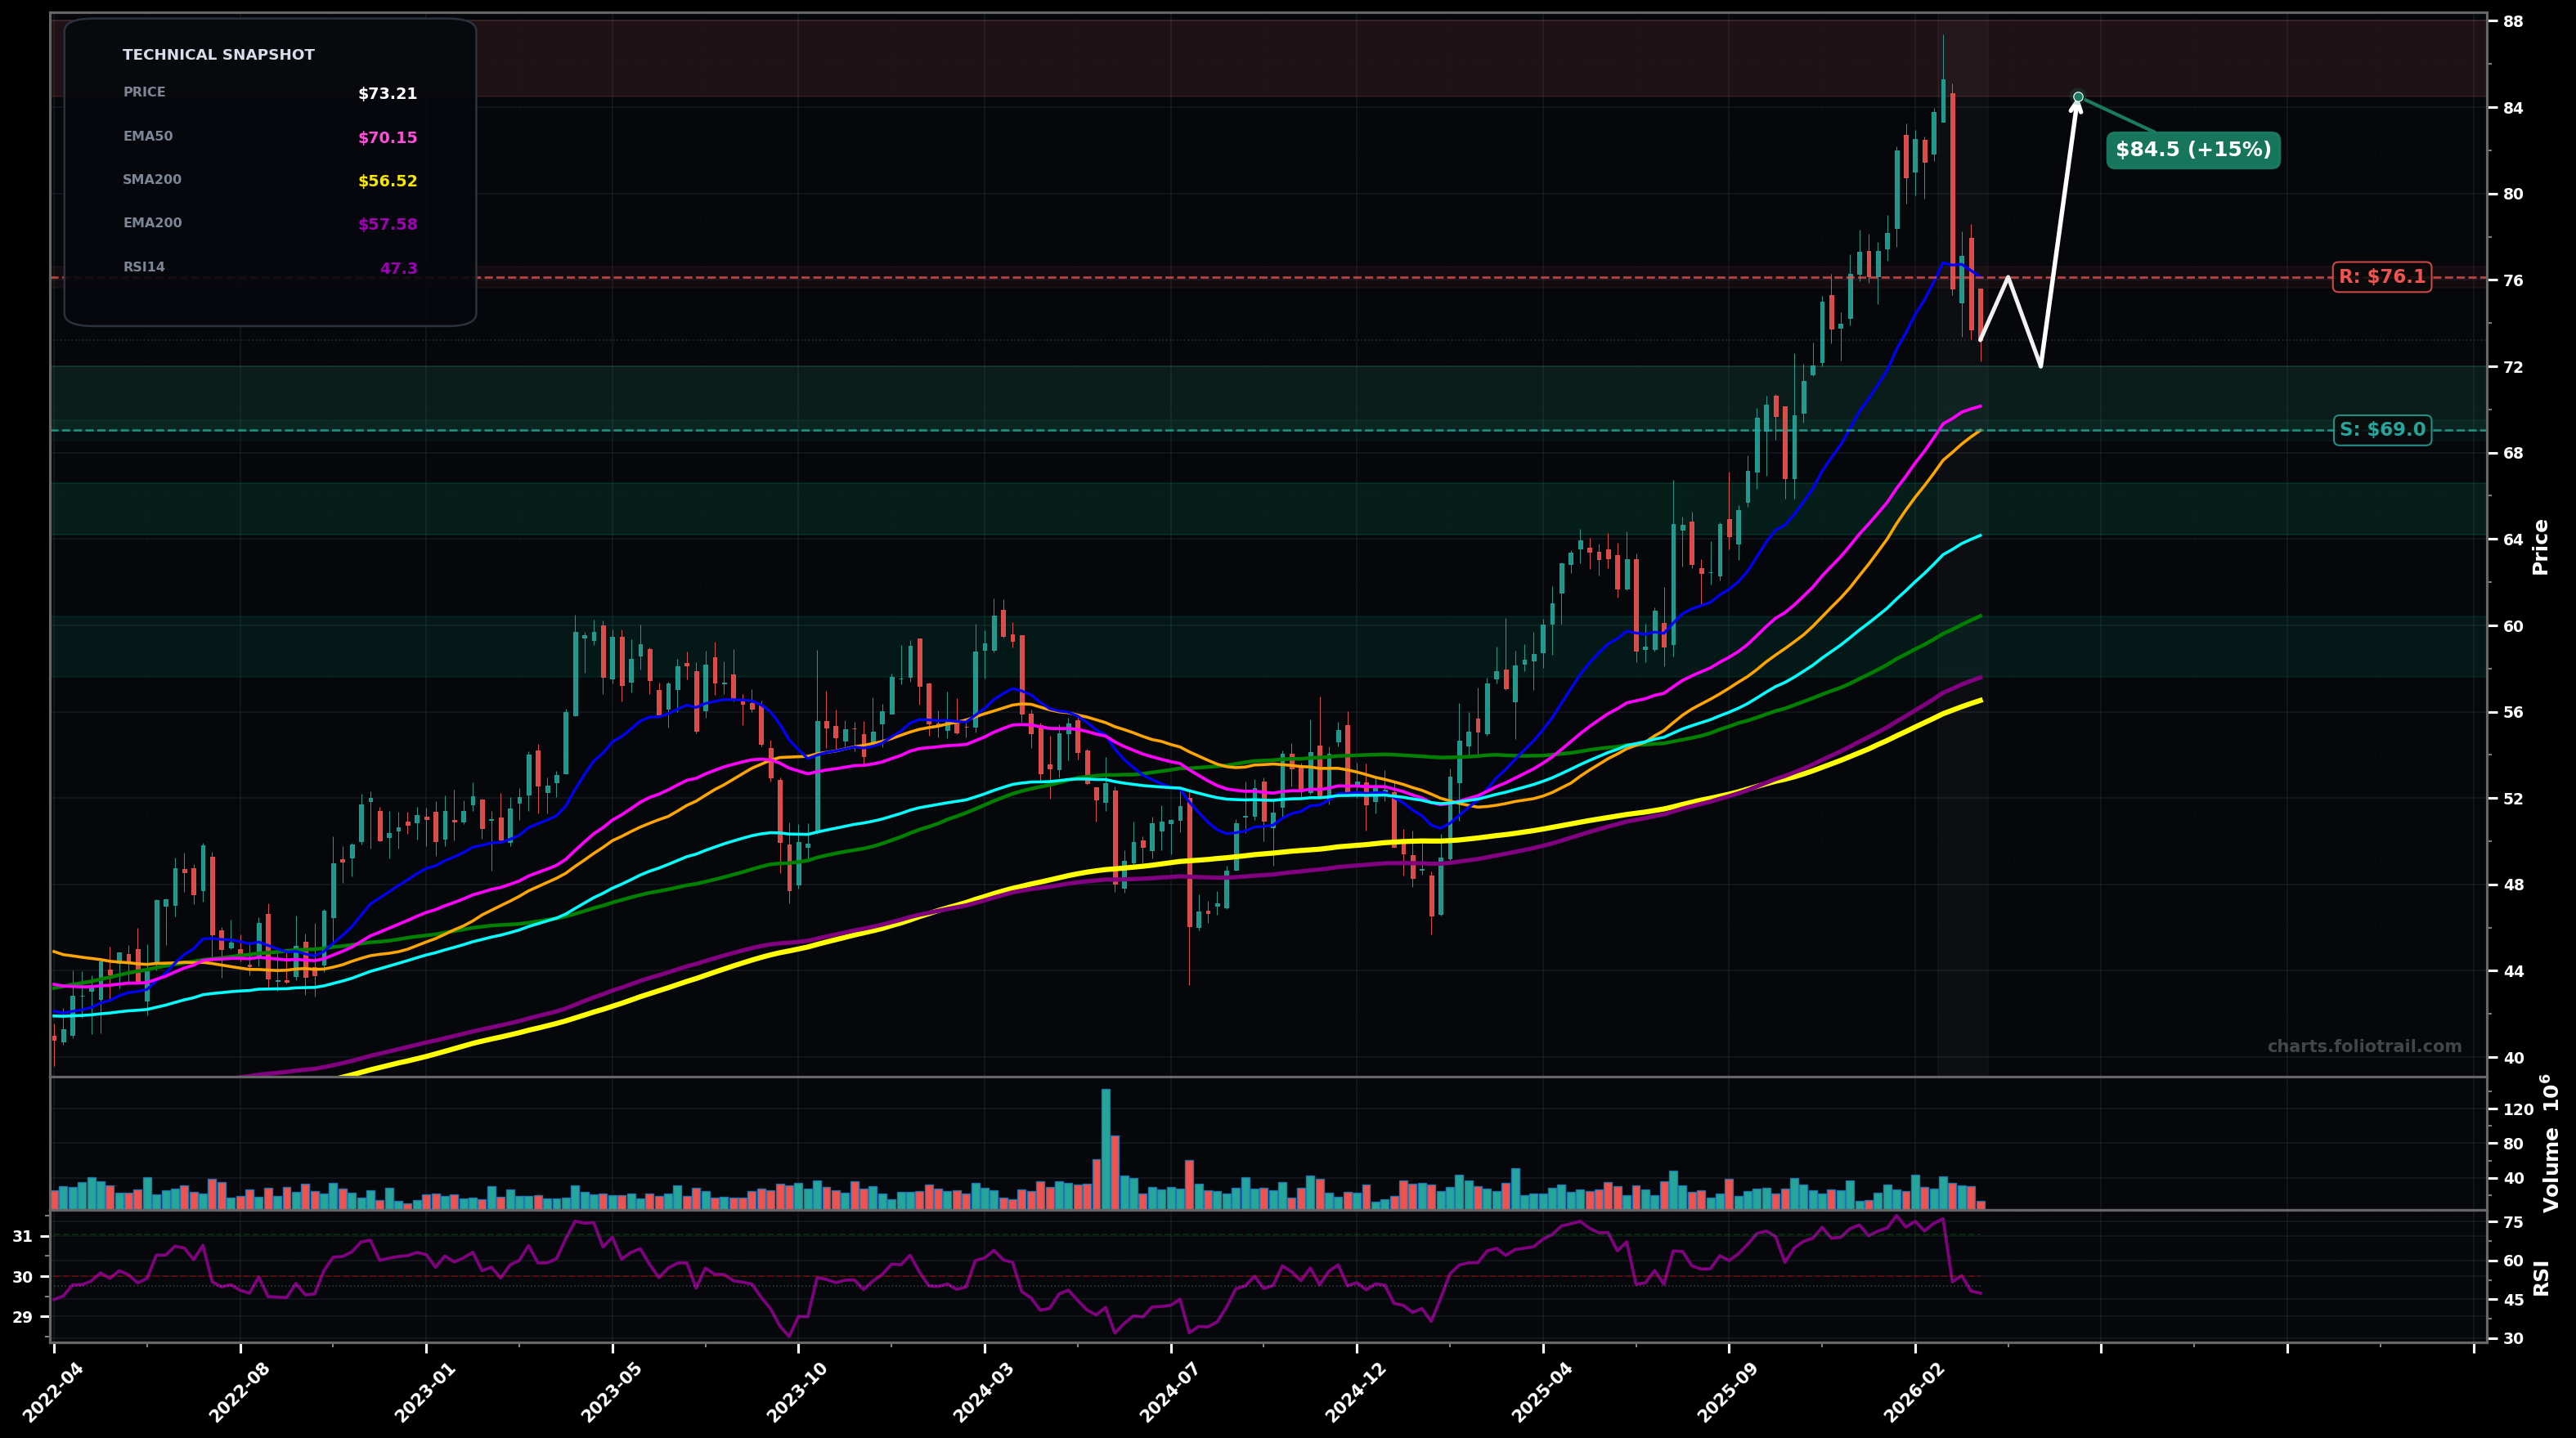
As of March 26, 2026, MNST (Monster Beverage Corporation) is in a volatility expansion state on the weekly chart, with a confidence level of 63%. Key support is at $69.0 and key resistance at $76.1. After a strong multi-month rally to a new swing high near $85, price pulled back sharply to ~$73, losing the short-term averages (EMA20/EMA50) and printing a short-term LH/LL sequence while still holding above the rising medium/long MAs (EMA100/SMA100/SMA200).
Bullish consolidation then continuation: price bases between the $69-$76 area, reclaims EMA20, and attempts a retest of the prior swing high; fits an Elliott Wave view of a Wave 4 pullback after a strong Wave 3 advance, with Wave 5 still possible.
Deeper correction: failure to reclaim $76 and a breakdown under SMA50 leads to a larger ABC-style retrace toward the rising EMA100/SMA100 cluster; this would still be consistent with a higher-timeframe uptrend but with a longer digestion phase.
Weekly close back above $76.13 (EMA20) for 2 consecutive weeks
Weekly close below $69.03 (SMA50) and then below $64.16 (EMA100) on follow-through
Start near SMA50 support; add into EMA100/SMA100 confluence if correction extends; heavy add near EMA200/SMA200 zone where trend support is strongest if a full retrace occurs.
Trim into prior swing-high retest/new-high extension (Wave 5 risk zone); heavier trimming on clear price-extension above the rising EMA50/EMA100; full close only if a multi-year upside overshoot forms (parabolic/terminal wave characteristics).
As of March 26, 2026, MNST (Monster Beverage Corporation) is in a volatility expansion state on the weekly chart with 63% confidence. After a strong multi-month rally to a new swing high near $85, price pulled back sharply to ~$73, losing the short-term averages (EMA20/EMA50) and printing a short-term LH/LL sequence while still holding above the rising medium/long MAs (EMA100/SMA100/SMA200).
On the weekly timeframe, MNST has key support at $69.0 and key resistance at $76.1. The most likely scenario (bullish) targets $76.1 and $84.5, with a revert level at $72.0.
MNST (Monster Beverage Corporation) is currently classified as volatility expansion on the weekly chart, with 63% confidence. Confirmation requires: Weekly close back above $76.13 (EMA20) for 2 consecutive weeks This would be invalidated by: Weekly close below $69.03 (SMA50) and then below $64.16 (EMA100) on follow-through
The most likely scenario (bullish) targets $76.1 and $84.5, with a revert level at $72.0. The alternative scenario (bearish) targets $69.0 and $64.2.
Multi-layer AI agents analyse 200+ stocks across daily, weekly, and monthly timeframes — producing market state classifications, price scenarios with targets, and position entry/exit levels. Updated every trading day after market close. No paywall. No sign-up required.
Built by Foliotrail.
All content on this website — including charts, analysis, price targets, support/resistance levels, and position zones — is generated entirely by AI and provided for educational and informational purposes only.
This is not financial advice. NEXUSNOIR VENTURES SL (the operator of this website) is not a registered investment adviser or broker-dealer. You should not make investment decisions based solely on this information. Always do your own research and consult a qualified financial advisor.
By continuing, you acknowledge that you have read and agree to our full disclaimer & terms of use and privacy policy.