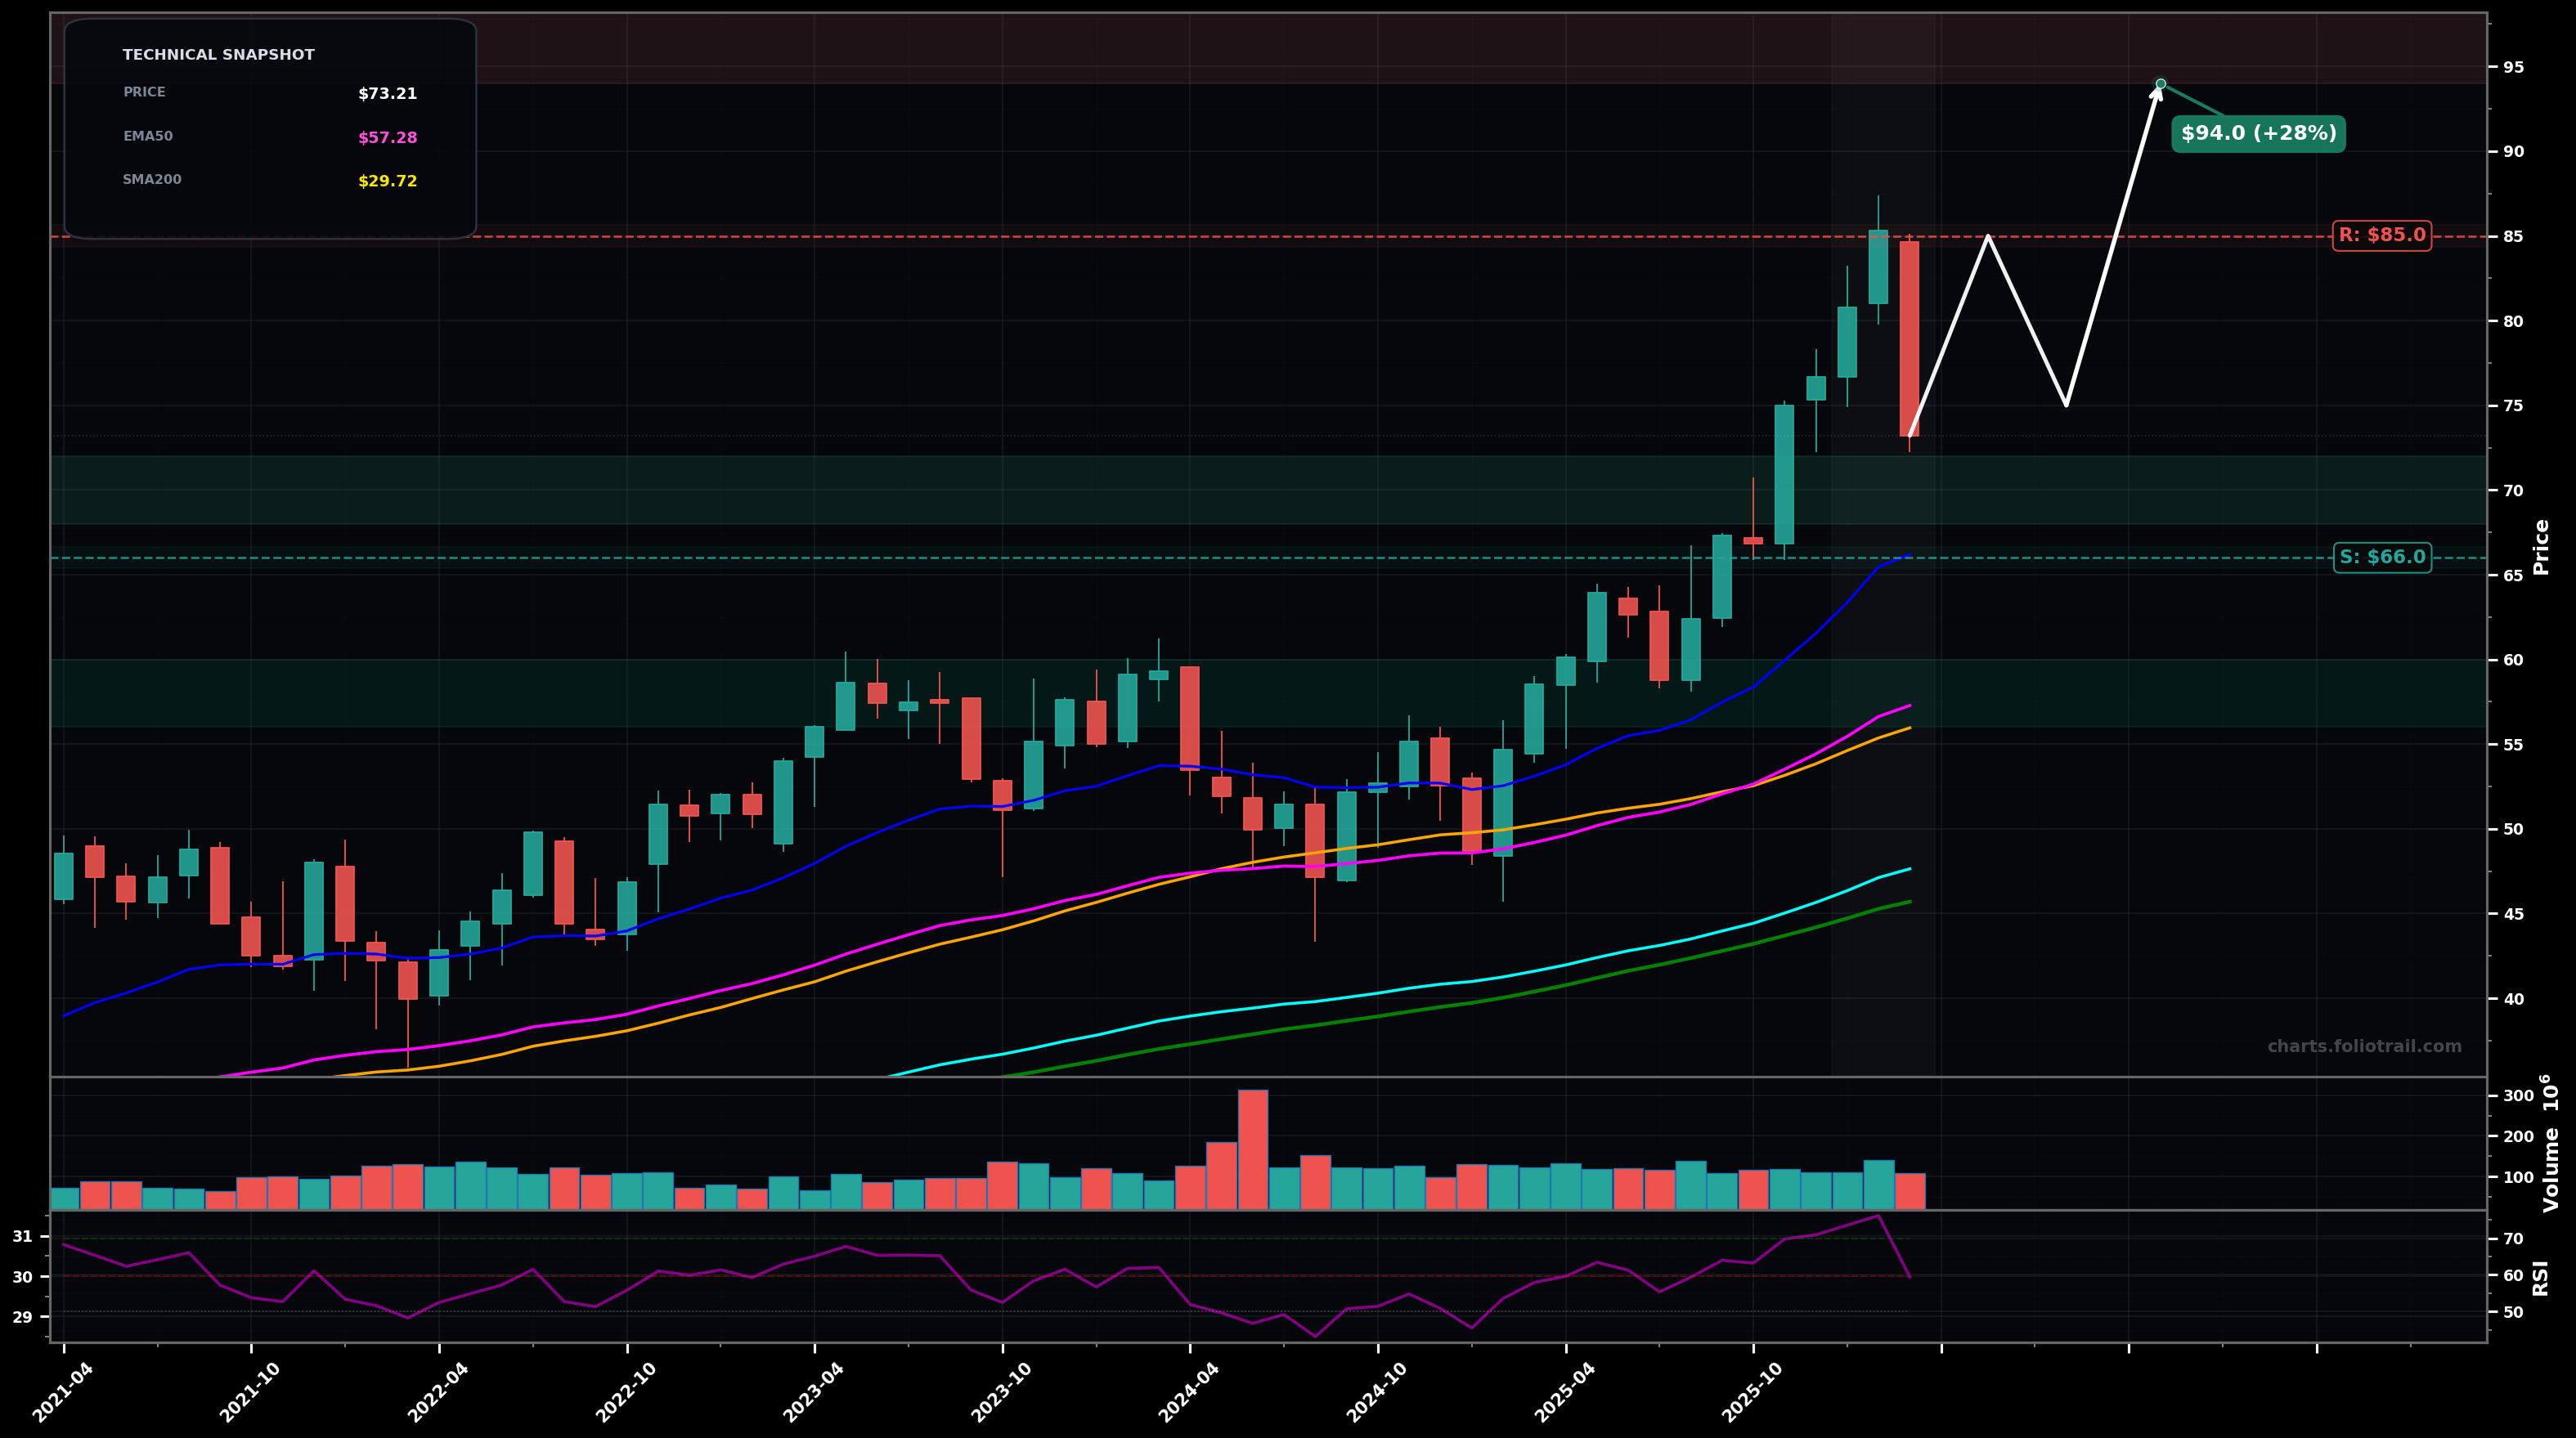
As of March 26, 2026, MNST (Monster Beverage Corporation) is in a uptrend state on the monthly chart, with a confidence level of 72%. Key support is at $66.0 and key resistance at $85.0. Strong multi-month advance into ~$84-$85 followed by a sharp pullback to ~$73, still holding well above rising EMA50/EMA100.
Bullish continuation after a Wave 4-style pullback: price bases between ~$66-$75, then resumes the primary uptrend for a retest of the highs and a measured extension.
Deeper correction (larger Wave 4 / ABC): loss of ~$66 leads to a drop toward the rising 50-month area and prior breakout zone before attempting to stabilize.
Monthly close back above $75.00 and then a break/close above $85.00
Monthly close below $66.00 (loss of EMA20/near-term swing support zone)
Buy-the-dip structure in an uptrend: starter near prior consolidation/EMA cluster, add on a deeper pullback to key swing support, heavy add only at the 50-month/EMA50 area if a full Wave-4/ABC plays out.
Trim into Fibonacci-style extensions above the prior impulse (post-$85 breakout) where price is likely stretched vs EMA50/EMA100; full exit only if a multi-year overshoot develops.
As of March 26, 2026, MNST (Monster Beverage Corporation) is in a uptrend state on the monthly chart with 72% confidence. Strong multi-month advance into ~$84-$85 followed by a sharp pullback to ~$73, still holding well above rising EMA50/EMA100.
On the monthly timeframe, MNST has key support at $66.0 and key resistance at $85.0. The most likely scenario (bullish) targets $85.0 and $94.0, with a revert level at $75.0.
MNST (Monster Beverage Corporation) is currently classified as uptrend on the monthly chart, with 72% confidence. Confirmation requires: Monthly close back above $75.00 and then a break/close above $85.00 This would be invalidated by: Monthly close below $66.00 (loss of EMA20/near-term swing support zone)
The most likely scenario (bullish) targets $85.0 and $94.0, with a revert level at $75.0. The alternative scenario (bearish) targets $62.0 and $57.0.
Multi-layer AI agents analyse 200+ stocks across daily, weekly, and monthly timeframes — producing market state classifications, price scenarios with targets, and position entry/exit levels. Updated every trading day after market close. No paywall. No sign-up required.
Built by Foliotrail.
All content on this website — including charts, analysis, price targets, support/resistance levels, and position zones — is generated entirely by AI and provided for educational and informational purposes only.
This is not financial advice. NEXUSNOIR VENTURES SL (the operator of this website) is not a registered investment adviser or broker-dealer. You should not make investment decisions based solely on this information. Always do your own research and consult a qualified financial advisor.
By continuing, you acknowledge that you have read and agree to our full disclaimer & terms of use and privacy policy.