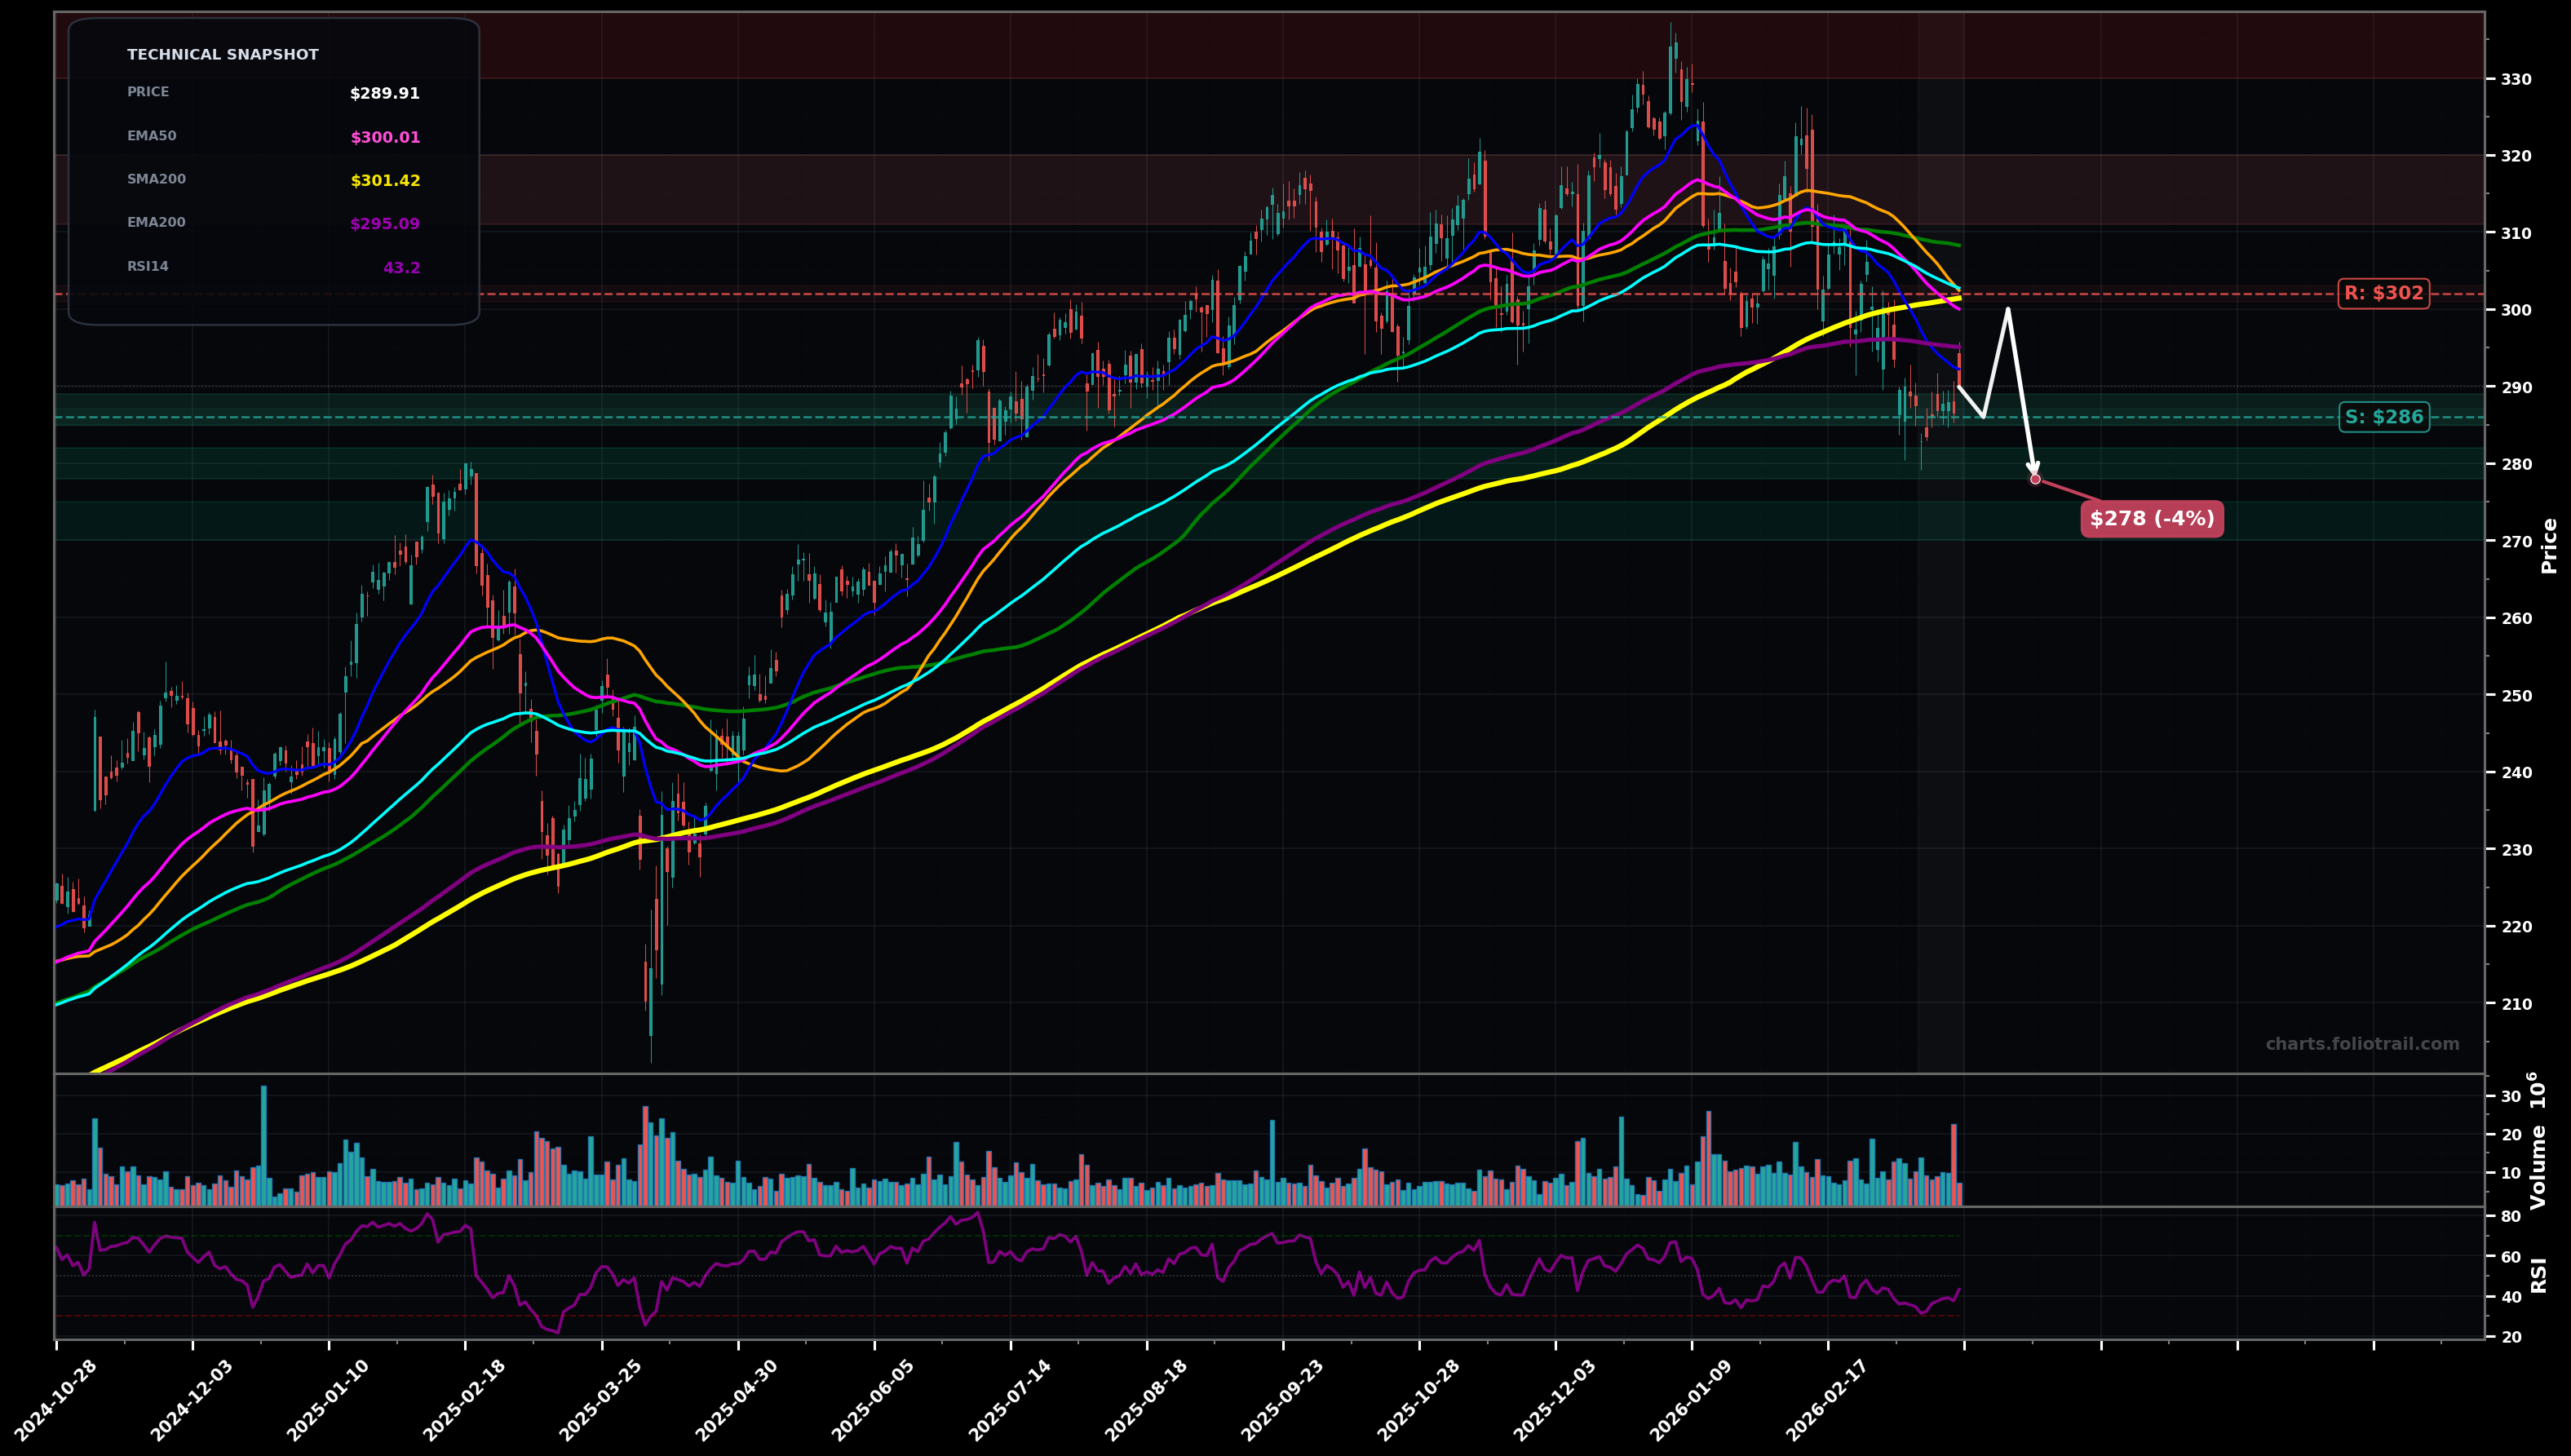
As of March 23, 2026, JPM (JPMorgan Chase & Co.) is in a downtrend state on the daily chart, with a confidence level of 67%. Key support is at $286 and key resistance at $302. Sharp selloff from the ~$330 area, now basing near ~$290 with price below the clustered $300-$310 moving averages; RSI ~43 (weak momentum, not oversold).
Bearish continuation: a failed bounce into the $300-$302 reclaim zone, then rollover to retest and break $286, with follow-through toward the rising long-term averages.
Bullish rebound: hold $286 and form a higher low, then reclaim $302 and push into the heavier resistance band around $308-$312 (SMA100/SMA200 cluster).
Daily close below $286 would confirm continuation lower (break of the current base/swing-low area).
Two consecutive daily closes back above $302 would invalidate the immediate downtrend bias (reclaim of EMA50/EMA100 zone).
Start near current swing-low support ($286); add on breakdown/retest toward the next demand shelf; heavy add near the bigger mean-reversion zone (prior base + fib/round-number confluence).
Trim into the MA/supply cluster first, trim more into the prior peak zone, and fully close if price returns to/extends beyond the prior high area where upside gets increasingly stretched.
As of March 23, 2026, JPM (JPMorgan Chase & Co.) is in a downtrend state on the daily chart with 67% confidence. Sharp selloff from the ~$330 area, now basing near ~$290 with price below the clustered $300-$310 moving averages; RSI ~43 (weak momentum, not oversold).
On the daily timeframe, JPM has key support at $286 and key resistance at $302. The most likely scenario (bearish) targets $286 and $278, with a revert level at $300.
JPM (JPMorgan Chase & Co.) is currently classified as downtrend on the daily chart, with 67% confidence. Confirmation requires: Daily close below $286 would confirm continuation lower (break of the current base/swing-low area). This would be invalidated by: Two consecutive daily closes back above $302 would invalidate the immediate downtrend bias (reclaim of EMA50/EMA100 zone).
The most likely scenario (bearish) targets $286 and $278, with a revert level at $300. The alternative scenario (bullish) targets $302 and $311.
All content on this website — including charts, analysis, price targets, support/resistance levels, and position zones — is generated entirely by AI and provided for educational and informational purposes only.
This is not financial advice. NEXUSNOIR VENTURES SL (the operator of this website) is not a registered investment adviser or broker-dealer. You should not make investment decisions based solely on this information. Always do your own research and consult a qualified financial advisor.
By continuing, you acknowledge that you have read and agree to our full disclaimer & terms of use and privacy policy.