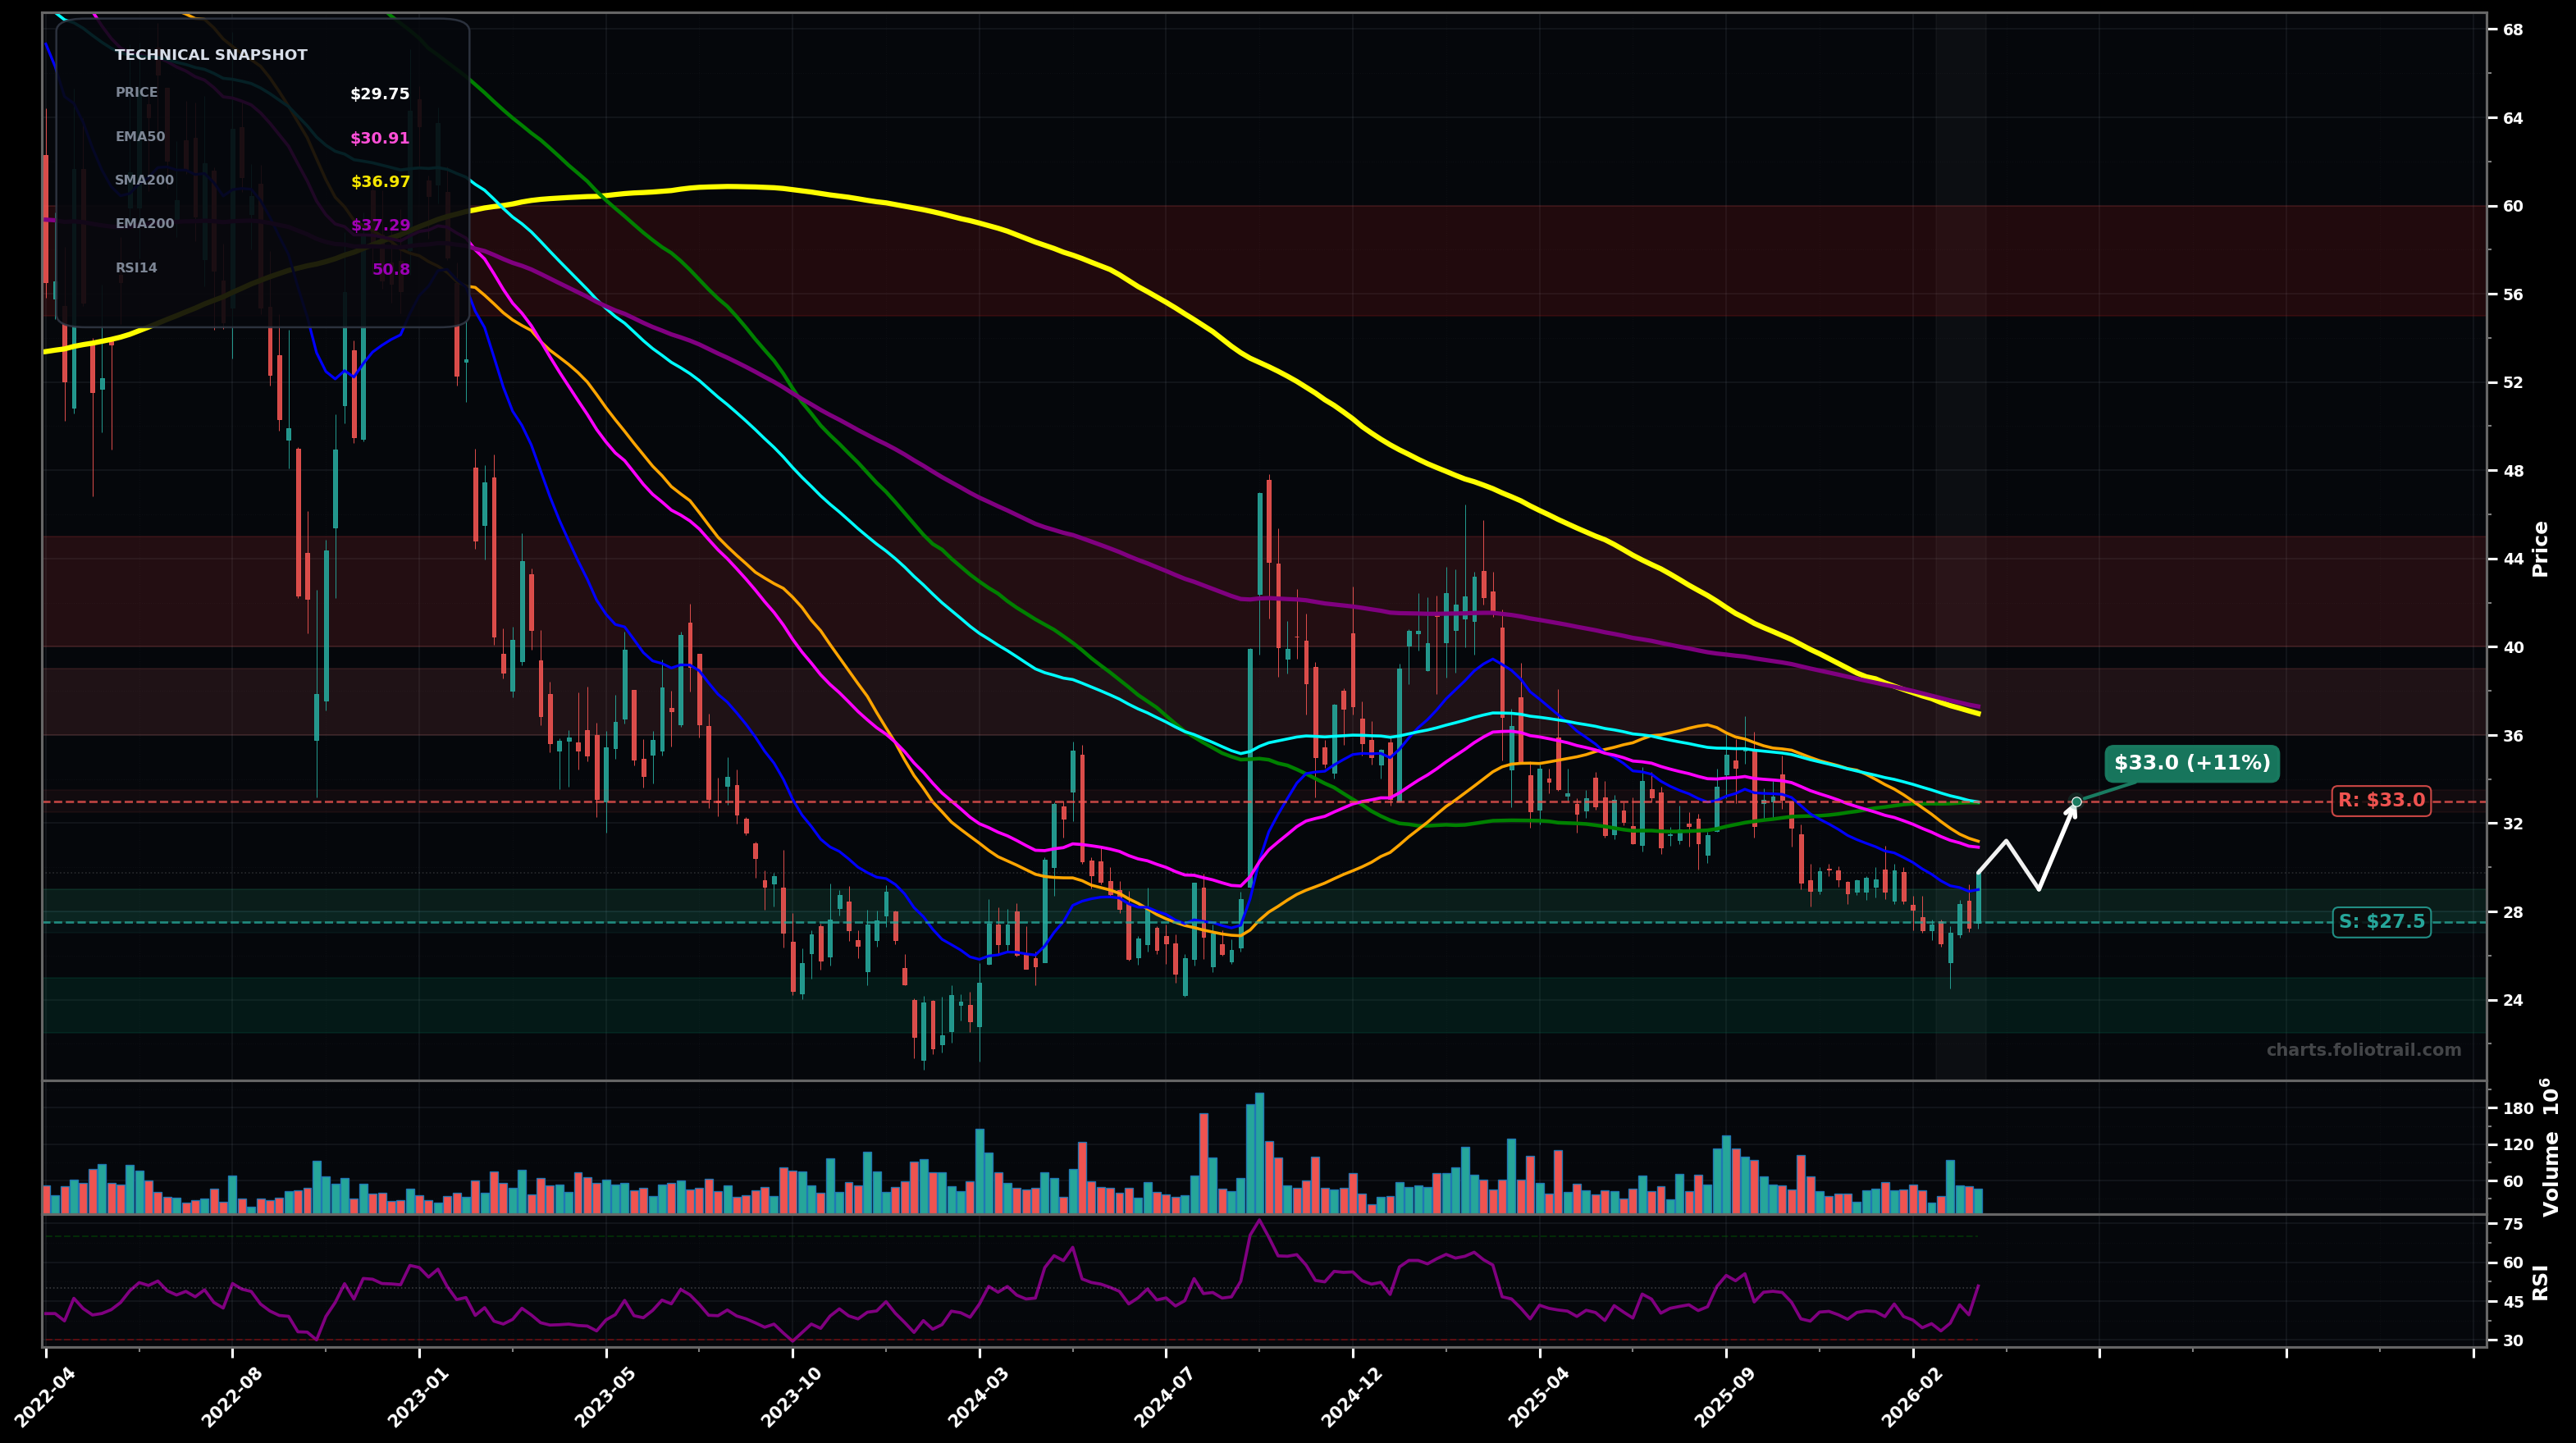
As of March 26, 2026, JD (JD.com Inc.) is in a downtrend state on the weekly chart, with a confidence level of 67%. Key support is at $27.5 and key resistance at $33.0. Weekly bounce from the recent swing low area; price ~$29.75 is still below the main trend MAs, RSI back near neutral (~50).
Mean-reversion bounce within the downtrend: price works higher into the $31-$33 MA cluster, then stalls/rejects and ranges or rolls over.
Breakout-reversal attempt: buyers hold above $29 and push through $33, opening a move toward the next higher resistance band.
Weekly close below $27.50 would confirm renewed downside continuation
2+ weekly closes above $33.00 (reclaiming EMA100/SMA100 area) would invalidate the downtrend bias
Layered entries around the swing-low support ($27.5) with deeper adds into prior capitulation area (~$25) and the larger base low region (~$22.5) if the downtrend resumes.
Trim into major overhead MA resistance (EMA200/SMA200 zone ~high $30s and prior distribution ~$40-$45); full exit only if a multi-year re-rating pushes into the prior macro supply area ~$55-$60.
As of March 26, 2026, JD (JD.com Inc.) is in a downtrend state on the weekly chart with 67% confidence. Weekly bounce from the recent swing low area; price ~$29.75 is still below the main trend MAs, RSI back near neutral (~50).
On the weekly timeframe, JD has key support at $27.5 and key resistance at $33.0. The most likely scenario (bearish) targets $31.2 and $33.0, with a revert level at $29.0.
JD (JD.com Inc.) is currently classified as downtrend on the weekly chart, with 67% confidence. Confirmation requires: Weekly close below $27.50 would confirm renewed downside continuation This would be invalidated by: 2+ weekly closes above $33.00 (reclaiming EMA100/SMA100 area) would invalidate the downtrend bias
The most likely scenario (bearish) targets $31.2 and $33.0, with a revert level at $29.0. The alternative scenario (bullish) targets $36.0 and $39.0.
Multi-layer AI agents analyse 200+ stocks across daily, weekly, and monthly timeframes — producing market state classifications, price scenarios with targets, and position entry/exit levels. Updated every trading day after market close. No paywall. No sign-up required.
Built by Foliotrail.
All content on this website — including charts, analysis, price targets, support/resistance levels, and position zones — is generated entirely by AI and provided for educational and informational purposes only.
This is not financial advice. NEXUSNOIR VENTURES SL (the operator of this website) is not a registered investment adviser or broker-dealer. You should not make investment decisions based solely on this information. Always do your own research and consult a qualified financial advisor.
By continuing, you acknowledge that you have read and agree to our full disclaimer & terms of use and privacy policy.