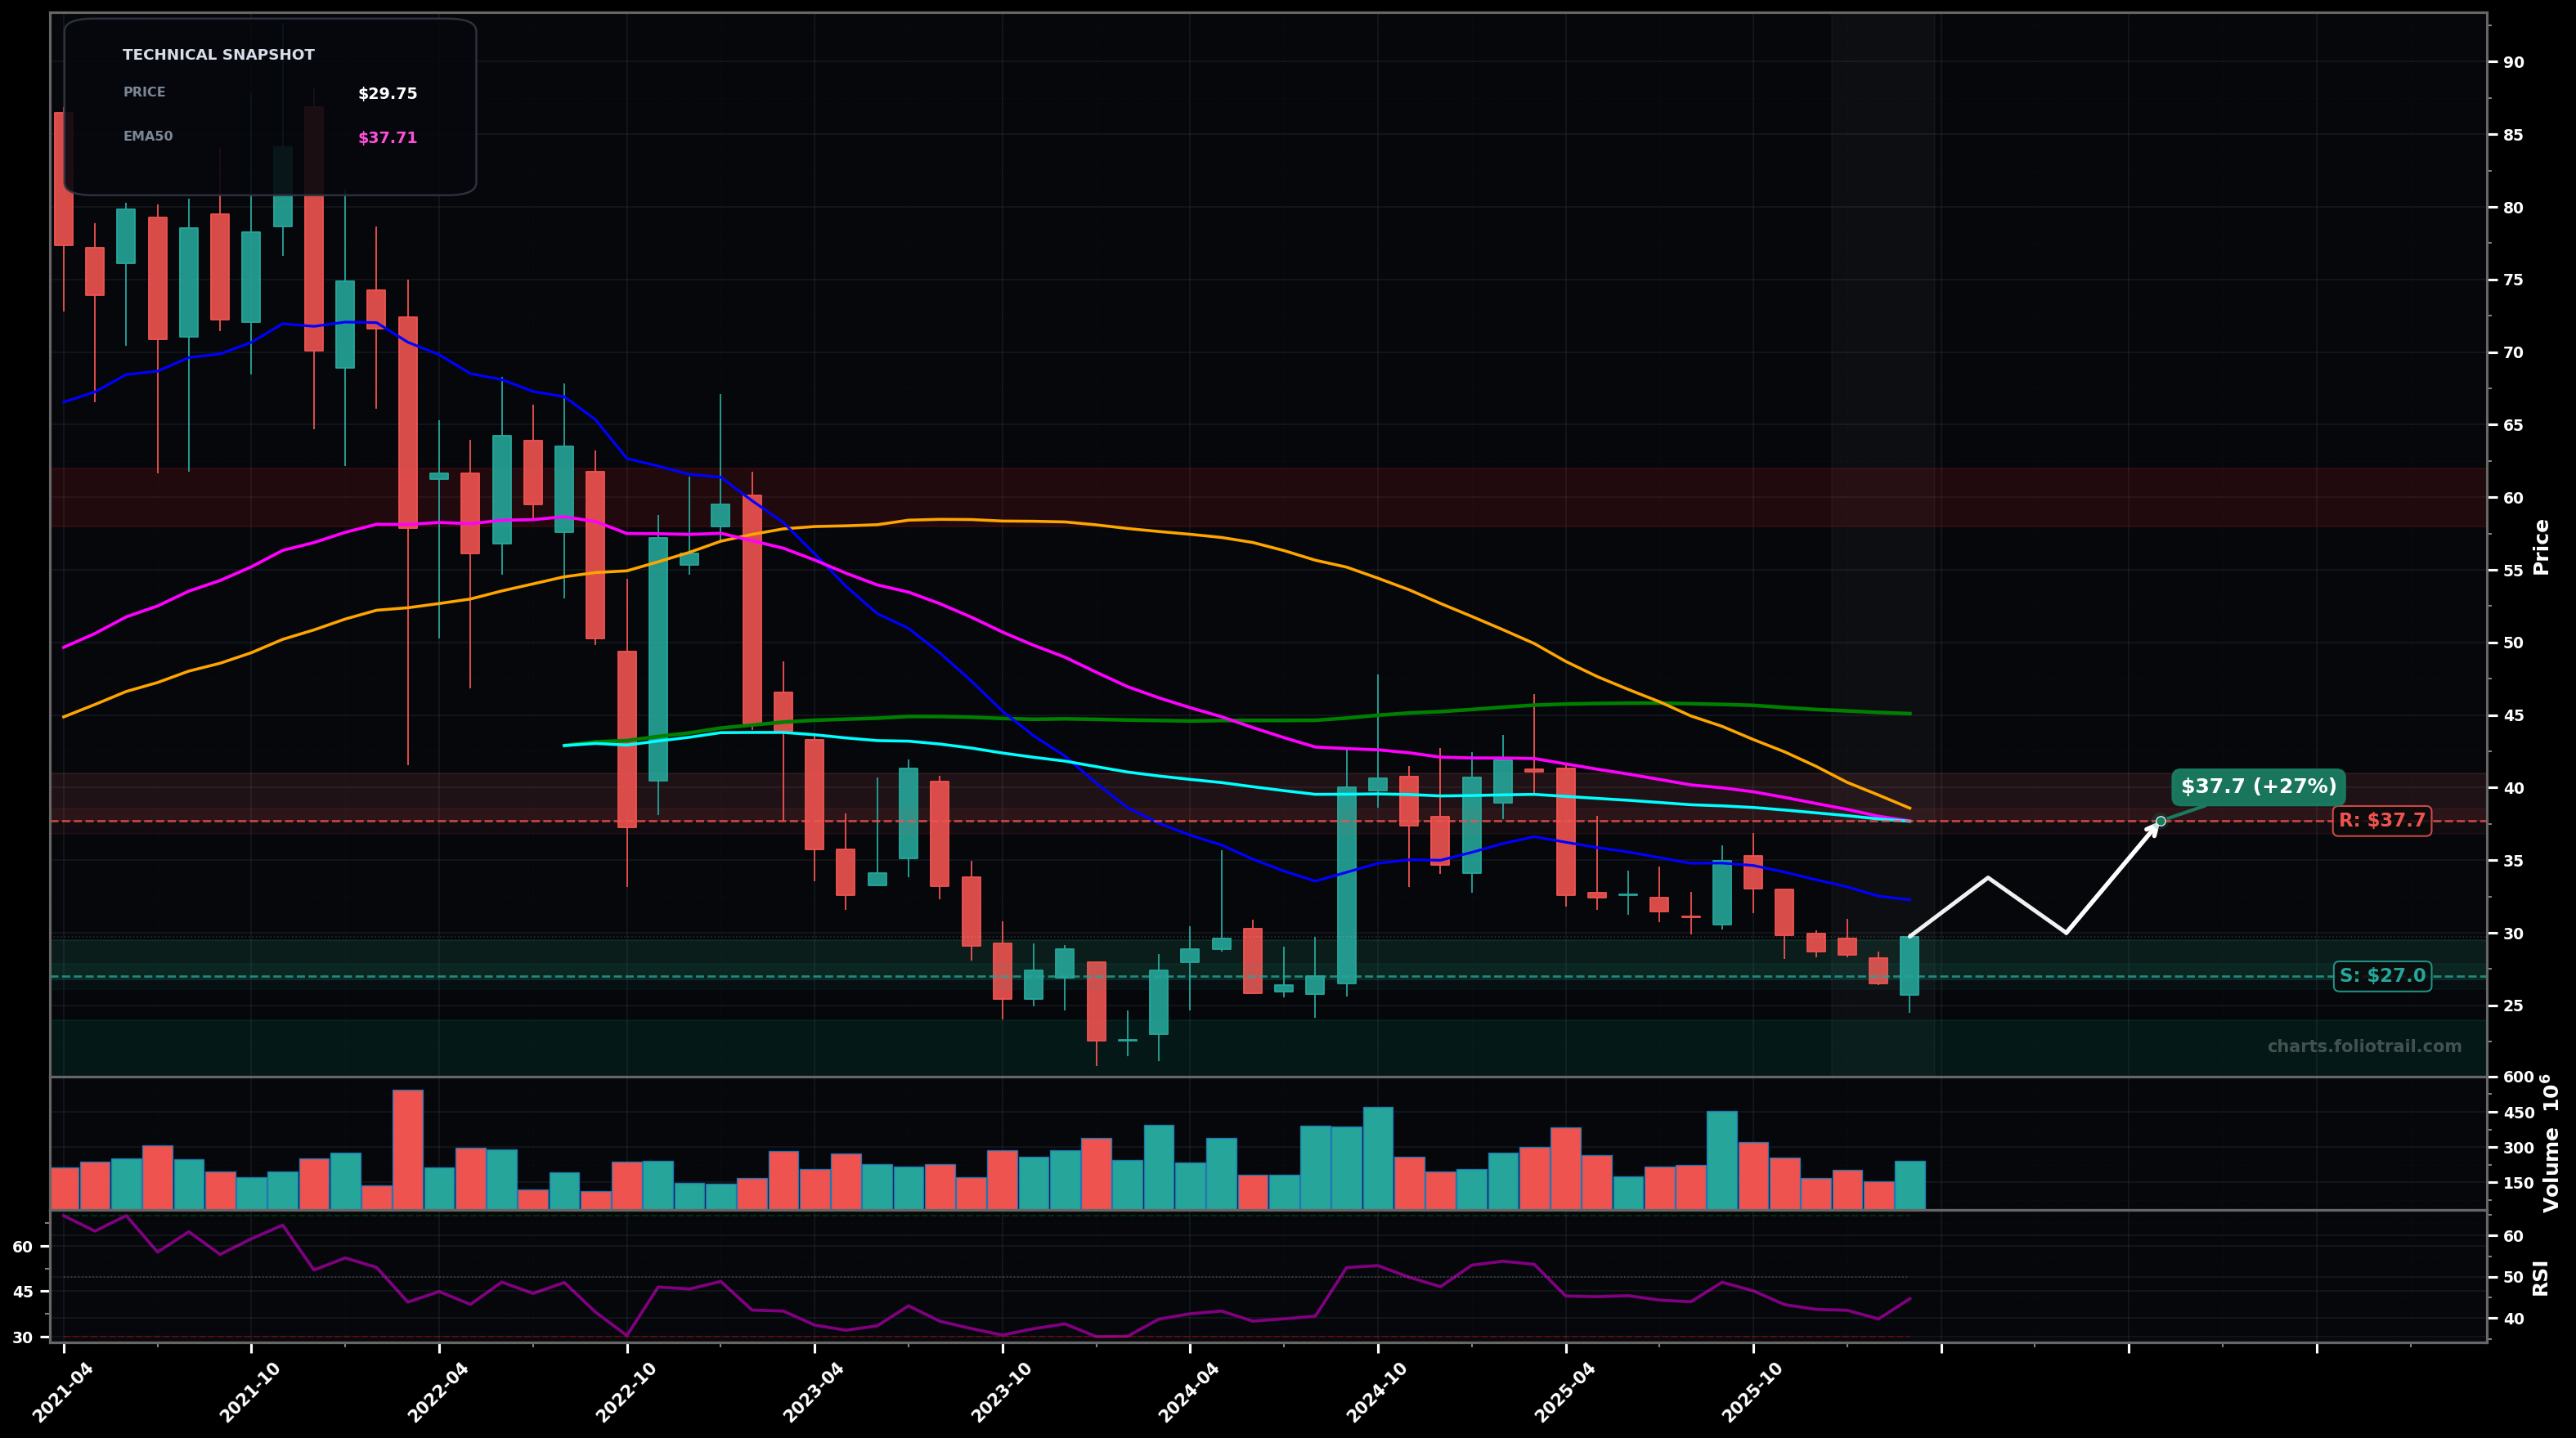
As of March 26, 2026, JD (JD.com Inc.) is in a downtrend state on the monthly chart, with a confidence level of 72%. Key support is at $27.0 and key resistance at $37.7. Monthly downtrend with a small bounce from the recent swing-low area; price still below falling fast MAs and beneath the overhead MA cluster.
Base attempt holds above the ~$27 swing-low reference, followed by a mean-reversion rally into the EMA50/EMA100 + SMA50 cluster, then stall/rejection (still a downtrend until reclaimed).
Support fails; price breaks the ~$27 pivot and accelerates lower (next leg down of the broader impulse), with only weak bounces back to prior support.
Bearish continuation confirmed on a monthly close below $27.00.
Downtend invalidated on 2 monthly closes above $37.70 (reclaim EMA50/EMA100 cluster).
Start near the current swing-low support ($27) for a base attempt; add on breakdown/flush into next fib-like extension areas; heavy add only if capitulation to the low-$20s while watching for monthly reversal candles.
Trim into the first major MA ceiling (EMA50/EMA100/SMA50 area), trim more near SMA100 (~$45) and the broader supply zone ~$50; close into the long-term overhead band near prior base/200MA region (area of max mean-reversion stretch).
As of March 26, 2026, JD (JD.com Inc.) is in a downtrend state on the monthly chart with 72% confidence. Monthly downtrend with a small bounce from the recent swing-low area; price still below falling fast MAs and beneath the overhead MA cluster.
On the monthly timeframe, JD has key support at $27.0 and key resistance at $37.7. The most likely scenario (bullish) targets $33.8 and $37.7, with a revert level at $30.0.
JD (JD.com Inc.) is currently classified as downtrend on the monthly chart, with 72% confidence. Confirmation requires: Bearish continuation confirmed on a monthly close below $27.00. This would be invalidated by: Downtend invalidated on 2 monthly closes above $37.70 (reclaim EMA50/EMA100 cluster).
The most likely scenario (bullish) targets $33.8 and $37.7, with a revert level at $30.0. The alternative scenario (bearish) targets $24.0 and $20.0.
Multi-layer AI agents analyse 200+ stocks across daily, weekly, and monthly timeframes — producing market state classifications, price scenarios with targets, and position entry/exit levels. Updated every trading day after market close. No paywall. No sign-up required.
Built by Foliotrail.
All content on this website — including charts, analysis, price targets, support/resistance levels, and position zones — is generated entirely by AI and provided for educational and informational purposes only.
This is not financial advice. NEXUSNOIR VENTURES SL (the operator of this website) is not a registered investment adviser or broker-dealer. You should not make investment decisions based solely on this information. Always do your own research and consult a qualified financial advisor.
By continuing, you acknowledge that you have read and agree to our full disclaimer & terms of use and privacy policy.