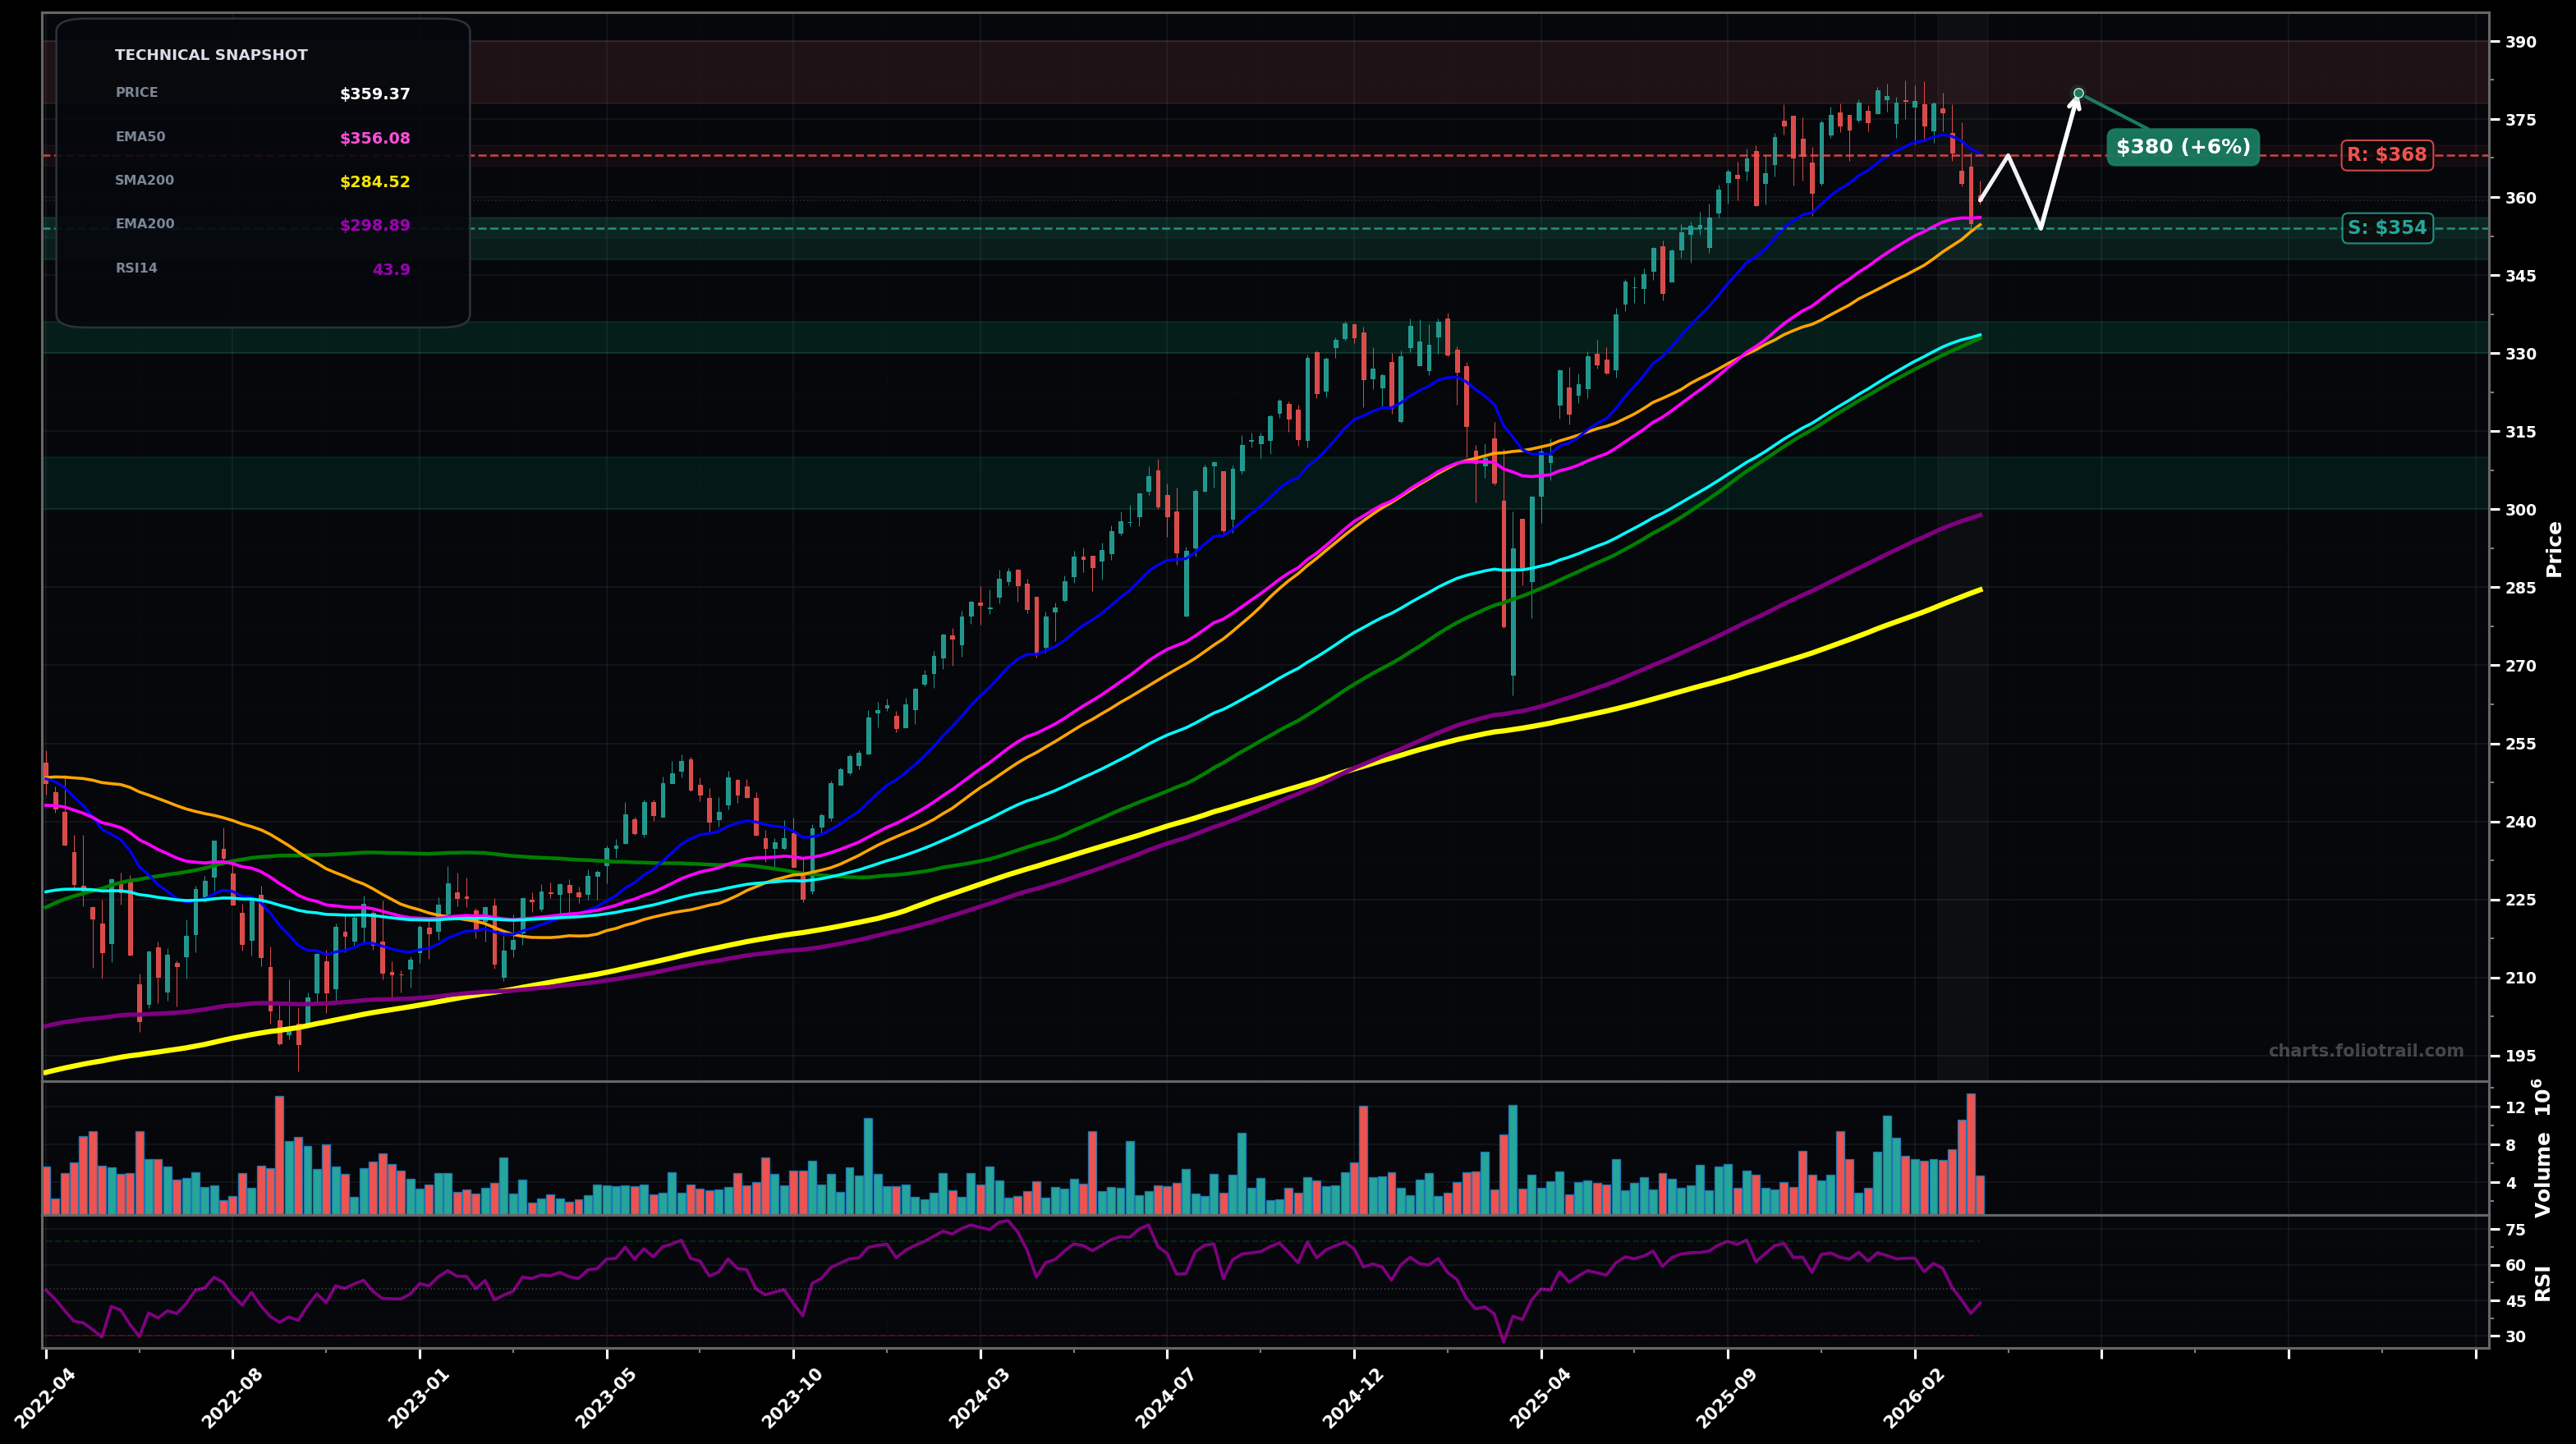
As of March 24, 2026, IWB (iShares Russell 1000 ETF) is in a uptrend state on the weekly chart, with a confidence level of 63%. Key support is at $354 and key resistance at $368. Weekly pullback from the ~$380 area; price ~$359 sitting just above rising SMA50/near EMA50 with RSI14 ~44 (momentum cooling).
Bullish continuation: pullback holds the $354-$350 area (SMA50/EMA50 zone), then reclaims $368 and grinds back toward the prior highs; Elliott view: likely a Wave 4 pullback within a larger impulsive advance, with Wave 5 attempt after reclaim.
Bearish/deeper correction: failure to regain $368 followed by a weekly close under $354 opens a mean-reversion drop toward the EMA100/SMA100 confluence; Fibonacci read: this would resemble a larger 0.382–0.50 retrace of the last impulse leg, with sellers targeting the mid-$330s.
Weekly close back above $368 (reclaim EMA20/short-term trend) would confirm uptrend continuation.
Weekly close below $333 (loss of EMA100) would invalidate the current uptrend state and shift bias to deeper correction.
Start near SMA50/EMA50 support ($350s); add on EMA100/SMA100 confluence ($330s); heavy add only if a deeper washout approaches rising EMA200 (~$299) where long-term trend support typically sits.
Trim into prior high/extension area (~$380s); heavier trims on clear Fibonacci extensions/overbought runs above prior highs; full exit only on a multi-year stretch well above trend MAs after a blow-off advance.
As of March 24, 2026, IWB (iShares Russell 1000 ETF) is in a uptrend state on the weekly chart with 63% confidence. Weekly pullback from the ~$380 area; price ~$359 sitting just above rising SMA50/near EMA50 with RSI14 ~44 (momentum cooling).
On the weekly timeframe, IWB has key support at $354 and key resistance at $368. The most likely scenario (bullish) targets $368 and $380, with a revert level at $354.
IWB (iShares Russell 1000 ETF) is currently classified as uptrend on the weekly chart, with 63% confidence. Confirmation requires: Weekly close back above $368 (reclaim EMA20/short-term trend) would confirm uptrend continuation. This would be invalidated by: Weekly close below $333 (loss of EMA100) would invalidate the current uptrend state and shift bias to deeper correction.
The most likely scenario (bullish) targets $368 and $380, with a revert level at $354. The alternative scenario (bearish) targets $333 and $320.
All content on this website — including charts, analysis, price targets, support/resistance levels, and position zones — is generated entirely by AI and provided for educational and informational purposes only.
This is not financial advice. NEXUSNOIR VENTURES SL (the operator of this website) is not a registered investment adviser or broker-dealer. You should not make investment decisions based solely on this information. Always do your own research and consult a qualified financial advisor.
By continuing, you acknowledge that you have read and agree to our full disclaimer & terms of use and privacy policy.