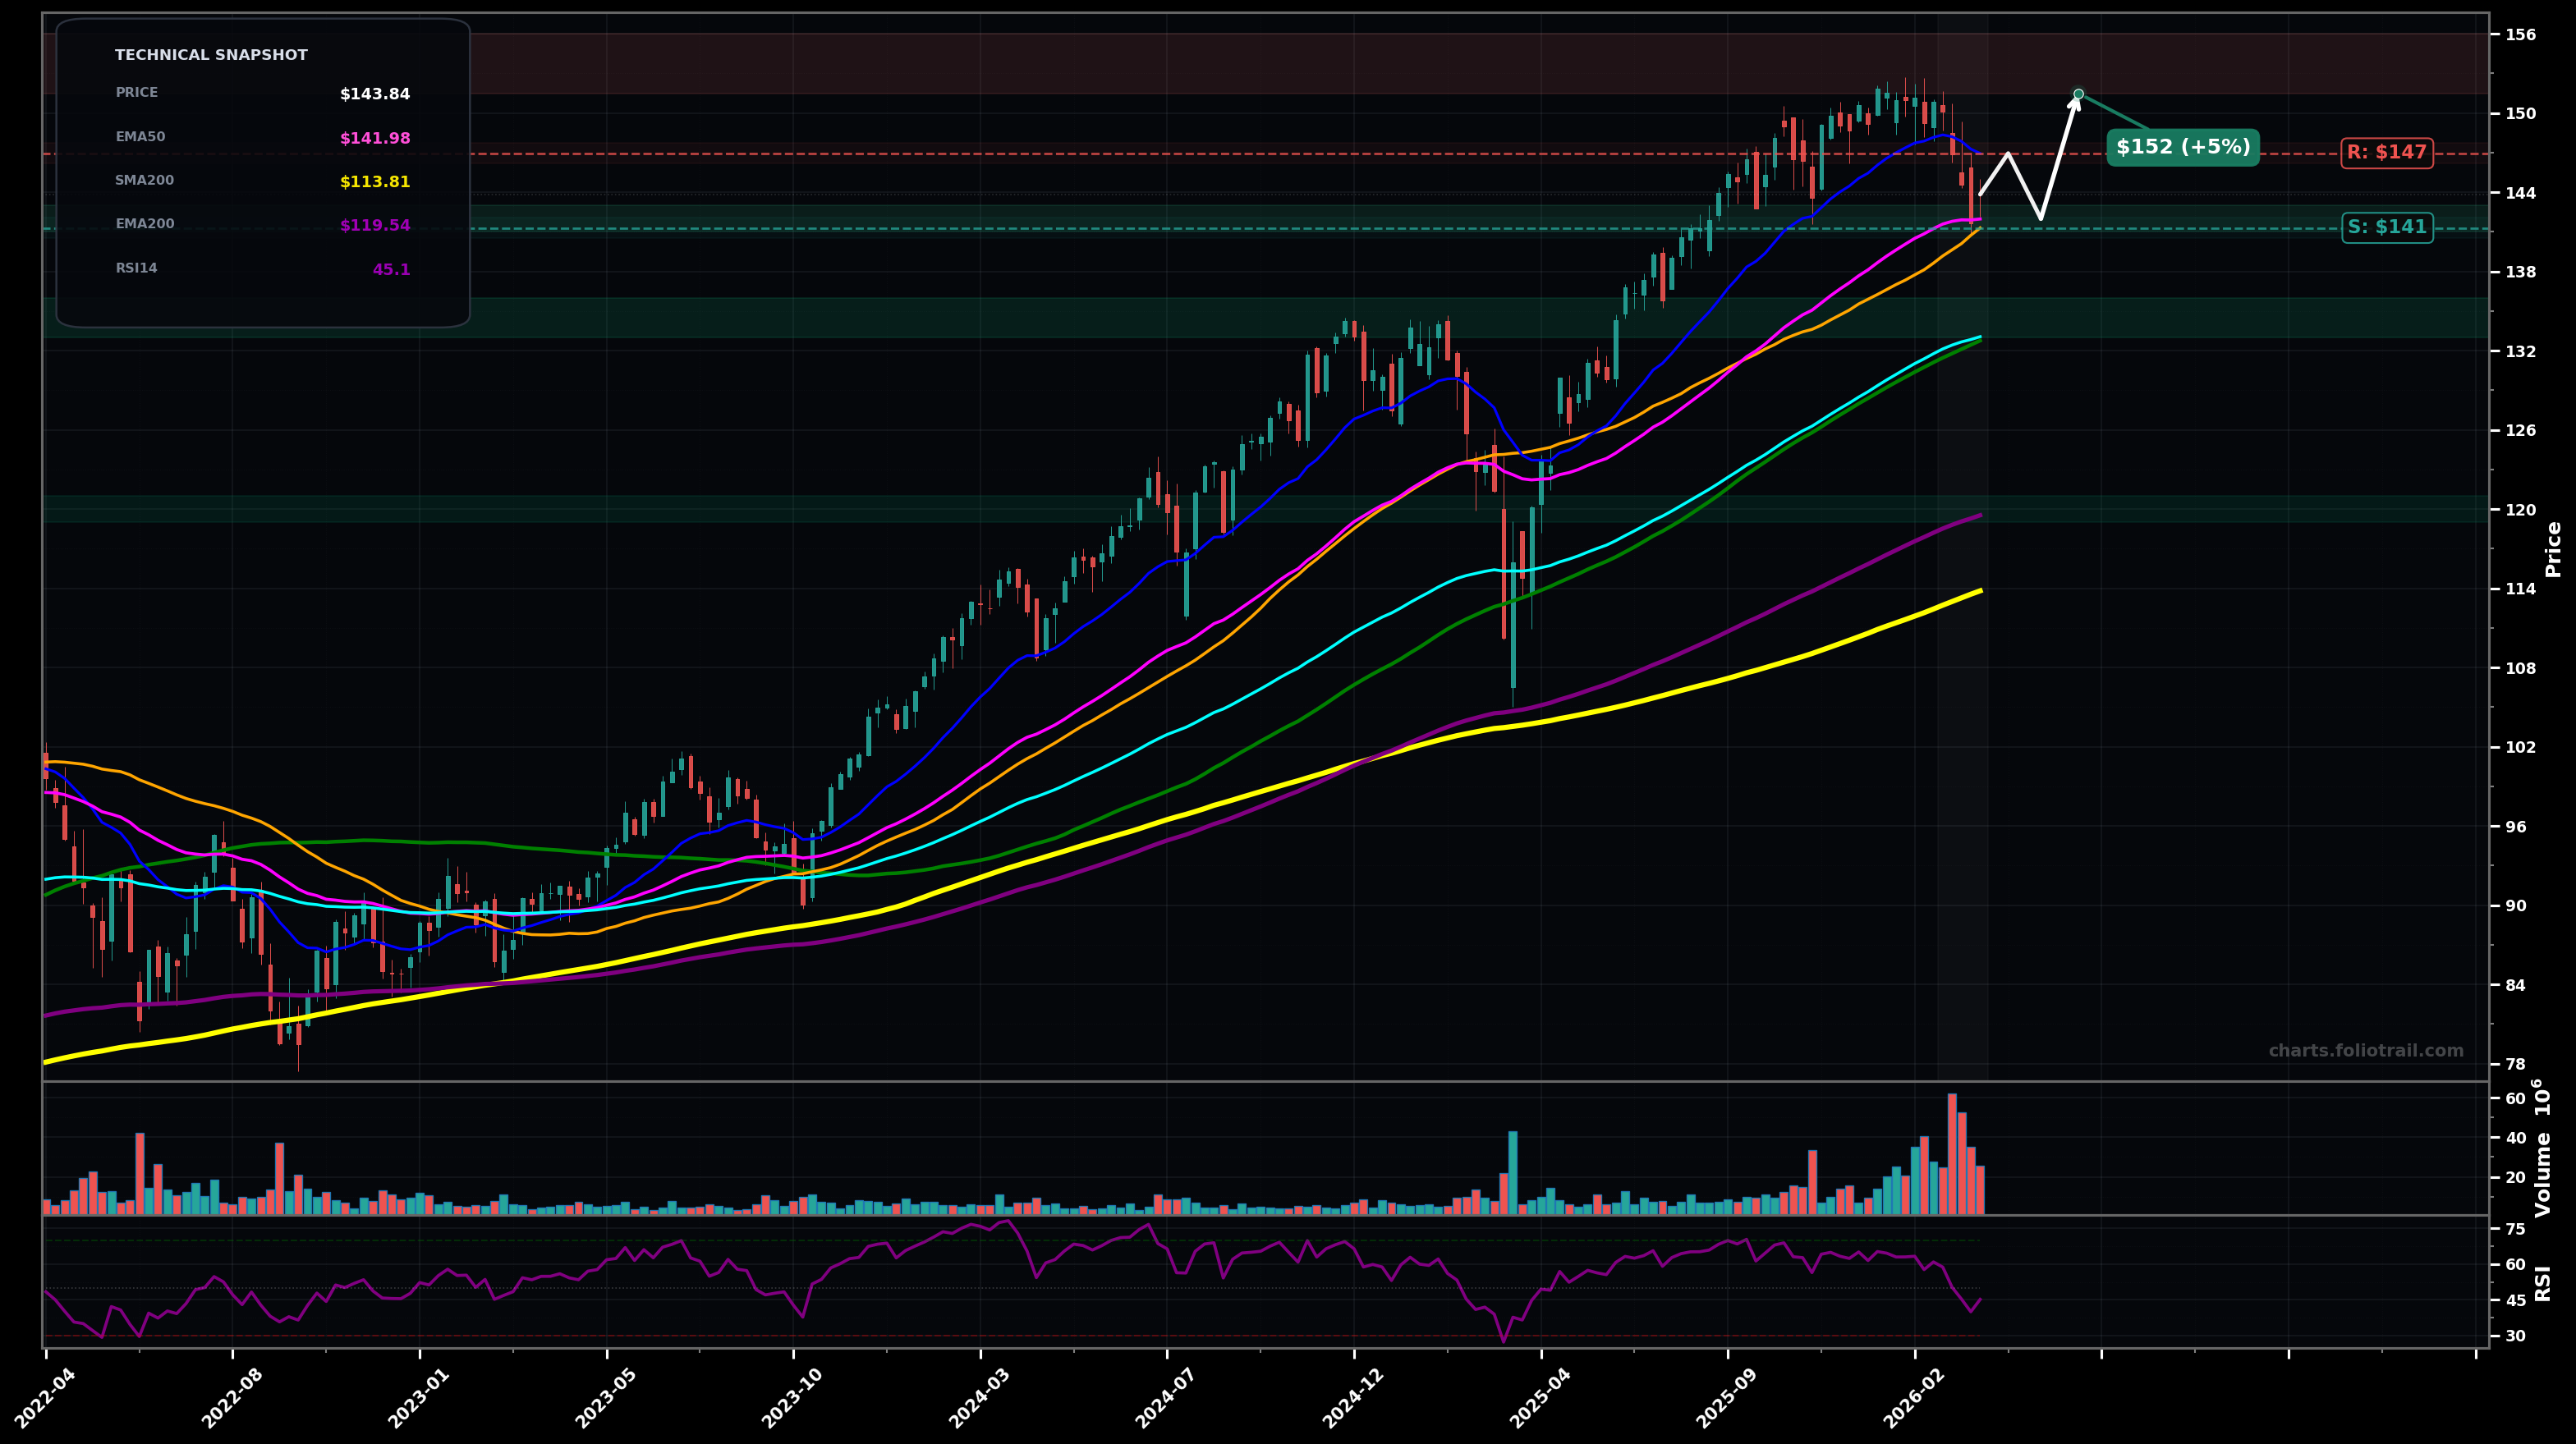
As of March 26, 2026, ITOT (iShares Core S&P Total U.S. Stock Market ETF) is in a bottoming attempt state on the weekly chart, with a confidence level of 58%. Key support is at $141 and key resistance at $147. Weekly pullback from ~$151–$152 highs to $143.84 with RSI(14) ~45; price testing the rising EMA50/SMA50 cluster near $142–$141 after a strong multi-month uptrend.
Base-and-bounce: price holds $141–$142 (EMA50/SMA50 area), reclaims EMA20, then retests the prior highs; fits an Elliott Wave view of a corrective wave (4) completing and wave (5) attempt starting. Fib-wise, this looks like a typical 38.2–50% pullback of the last upswing into the MA cluster.
Deeper correction: loss of the $141 area leads to a flush toward the rising EMA100/SMA100 zone; this would be consistent with a larger ABC correction where C extends and volume remains elevated.
2 weekly closes back above $146.95 (EMA20) with a higher low holding above $141.30 (SMA50).
Weekly close below $133.07 (EMA100) would shift this toward a DOWNTREND/risk-off leg.
Start near EMA50/SMA50 confluence support; add near EMA100/SMA100 trend support; heavy add only if a full mean-reversion toward EMA200 occurs (major support).
Trim into prior-high breakout/extension (likely wave (5) stretch); heavier trims on strong deviations above EMA50/EMA100; close if price becomes multi-year stretched relative to long MAs (late-cycle extension risk).
As of March 26, 2026, ITOT (iShares Core S&P Total U.S. Stock Market ETF) is in a bottoming attempt state on the weekly chart with 58% confidence. Weekly pullback from ~$151–$152 highs to $143.84 with RSI(14) ~45; price testing the rising EMA50/SMA50 cluster near $142–$141 after a strong multi-month uptrend.
On the weekly timeframe, ITOT has key support at $141 and key resistance at $147. The most likely scenario (bullish) targets $147 and $152, with a revert level at $142.
ITOT (iShares Core S&P Total U.S. Stock Market ETF) is currently classified as bottoming attempt on the weekly chart, with 58% confidence. Confirmation requires: 2 weekly closes back above $146.95 (EMA20) with a higher low holding above $141.30 (SMA50). This would be invalidated by: Weekly close below $133.07 (EMA100) would shift this toward a DOWNTREND/risk-off leg.
The most likely scenario (bullish) targets $147 and $152, with a revert level at $142. The alternative scenario (bearish) targets $133 and $120.
Multi-layer AI agents analyse 200+ stocks across daily, weekly, and monthly timeframes — producing market state classifications, price scenarios with targets, and position entry/exit levels. Updated every trading day after market close. No paywall. No sign-up required.
Built by Foliotrail.
All content on this website — including charts, analysis, price targets, support/resistance levels, and position zones — is generated entirely by AI and provided for educational and informational purposes only.
This is not financial advice. NEXUSNOIR VENTURES SL (the operator of this website) is not a registered investment adviser or broker-dealer. You should not make investment decisions based solely on this information. Always do your own research and consult a qualified financial advisor.
By continuing, you acknowledge that you have read and agree to our full disclaimer & terms of use and privacy policy.