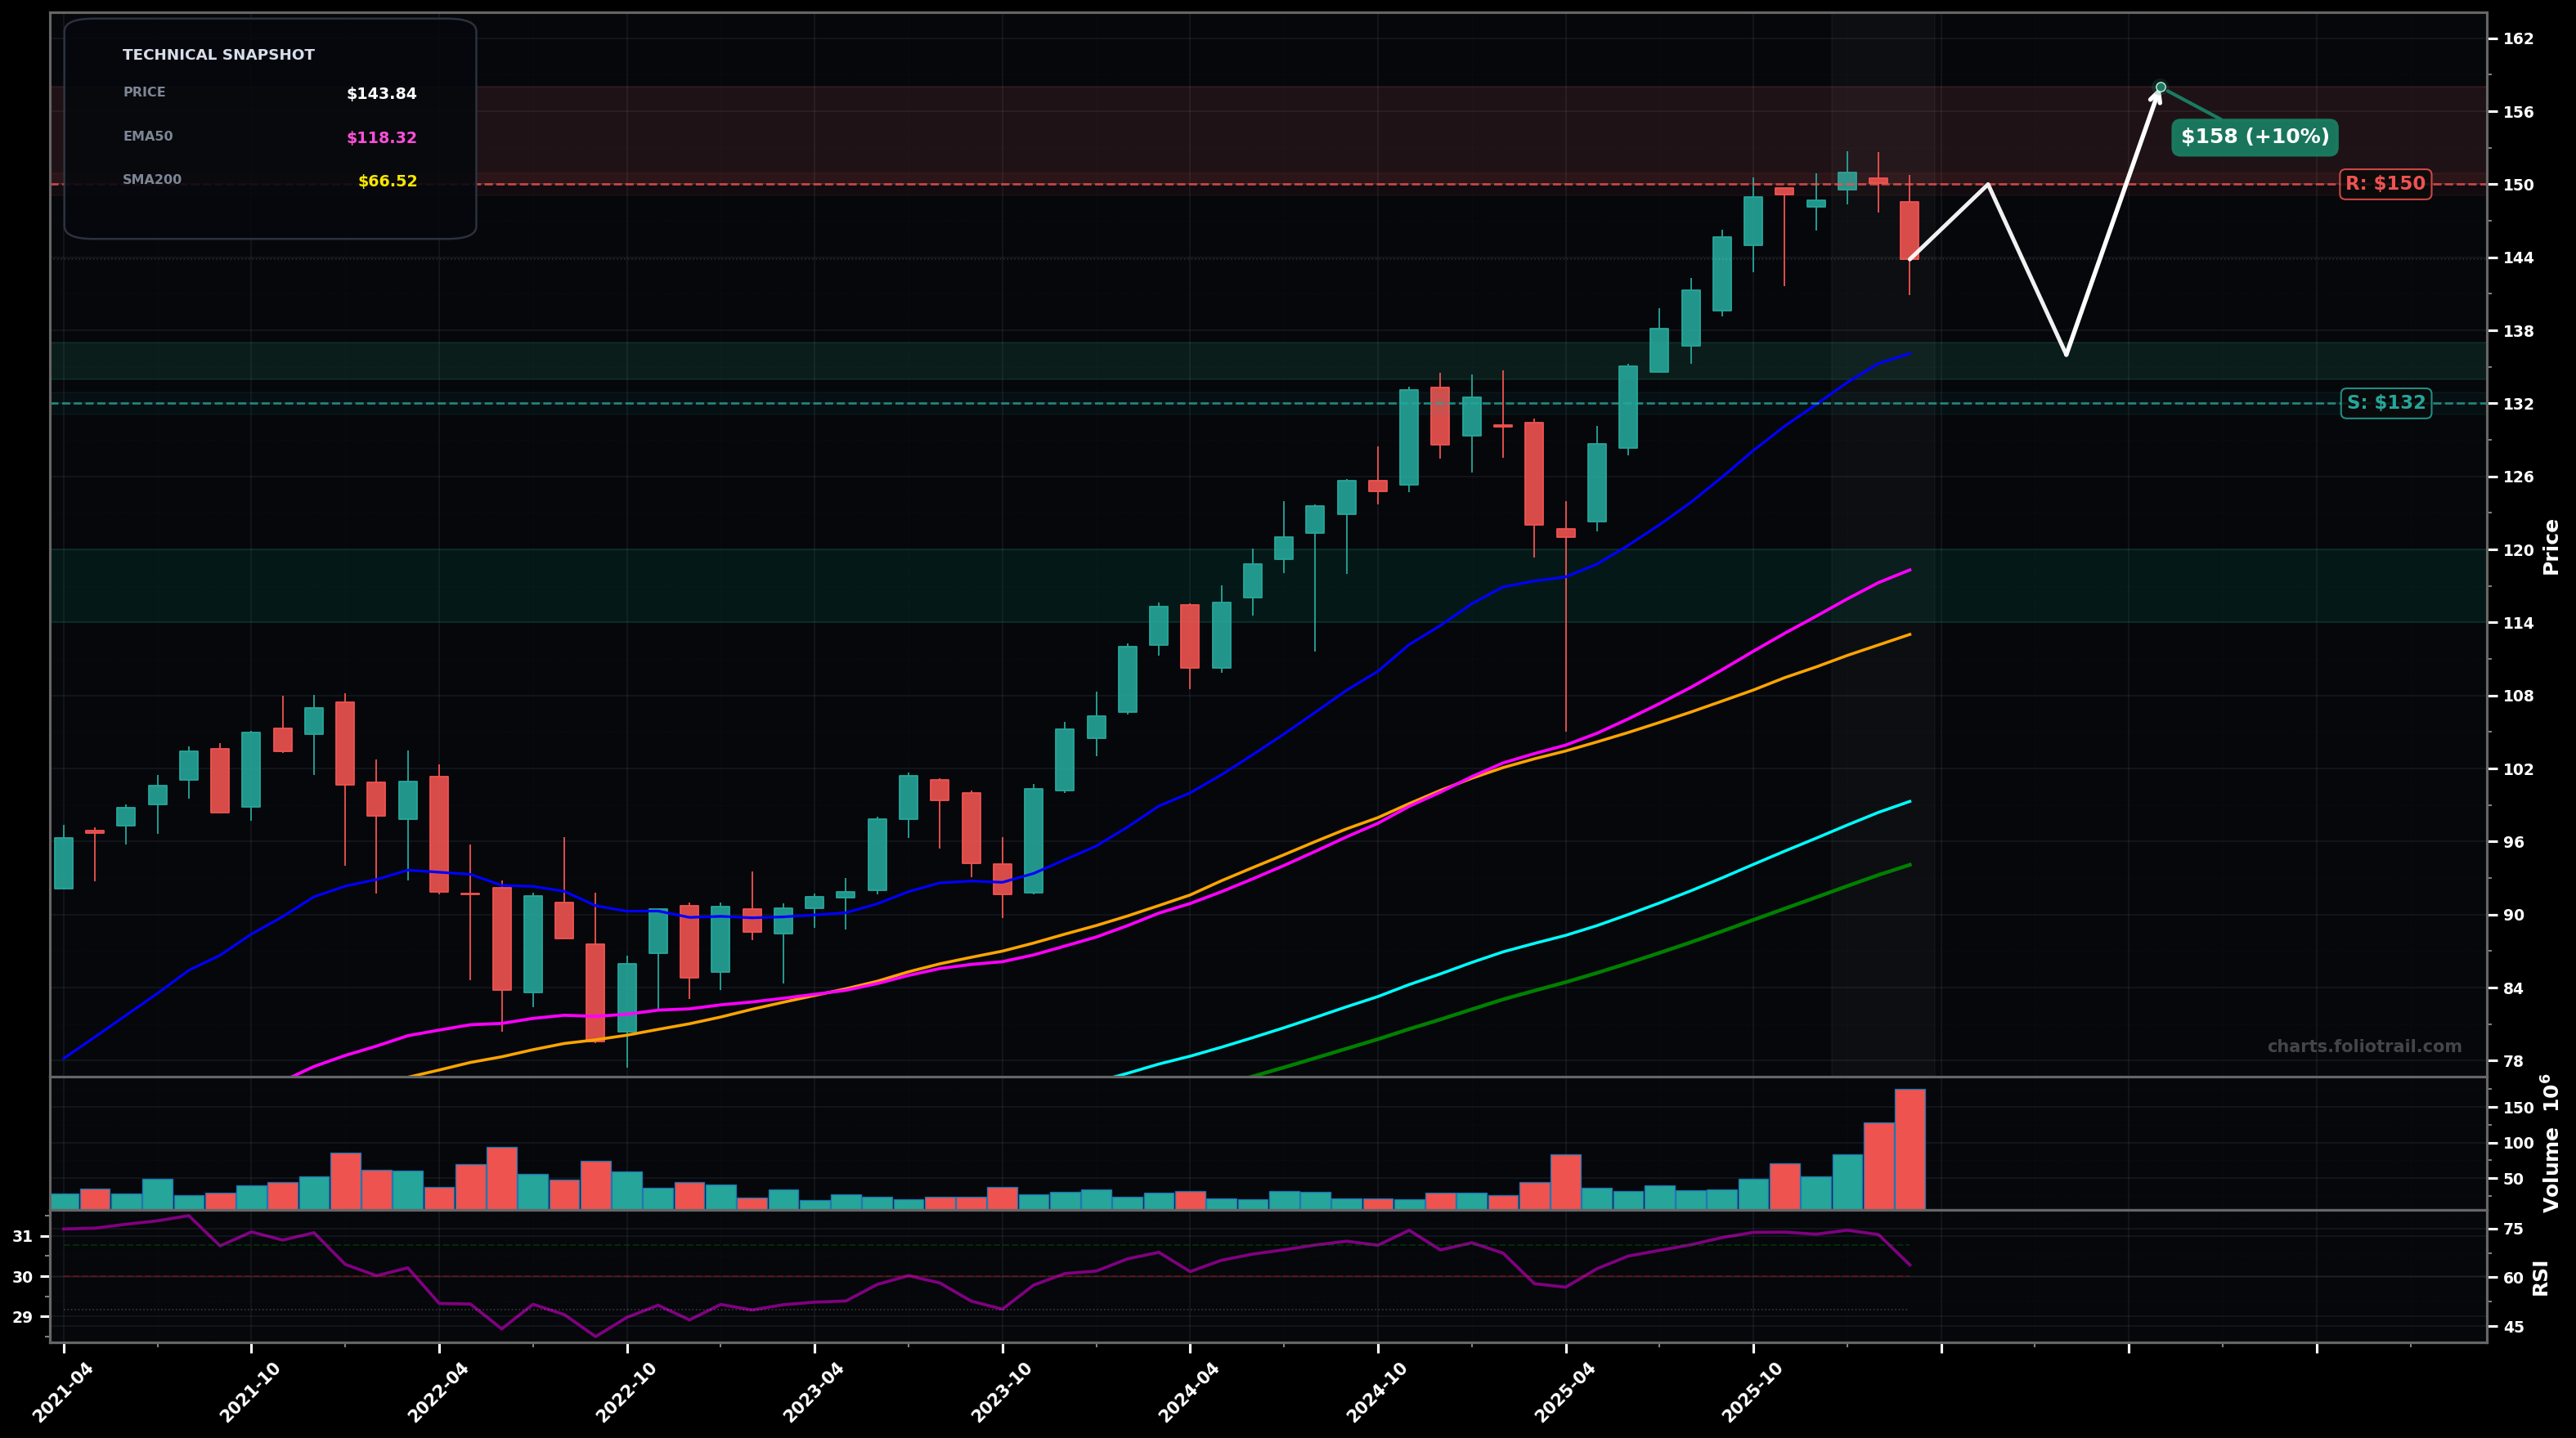
As of March 26, 2026, ITOT (iShares Core S&P Total U.S. Stock Market ETF) is in a uptrend state on the monthly chart, with a confidence level of 78%. Key support is at $132 and key resistance at $150. Monthly uptrend pulled back from ~$150 area on rising volume; price still well above rising EMA50/EMA100 and prior breakout zone.
Bullish continuation after a shallow pullback: price holds the prior breakout/20-EMA area and grinds back to retest highs, then attempts a new high (Elliott: late wave 4 consolidating before wave 5).
Deeper monthly ABC correction: rejection near $150 leads to a larger pullback toward the rising EMA50/SMA50 cluster; trend remains intact unless that zone fails (Fibo-style 38.2%–50% of the most recent impulsive leg).
Monthly close back above $150 would confirm trend continuation (wave 5 extension/breakout).
Monthly close below $132 would raise odds of a deeper ABC correction (loss of recent swing support).
Start near swing support/20-EMA area; add on deeper pullback toward prior breakout + psychological $125; heavy add at EMA50/SMA50 confluence where higher-timeframe trend support is strongest.
Trim into prior high breakout/possible wave-5 extension; larger trims if price becomes increasingly stretched above EMA50; close if a multi-year overextension forms with blow-off characteristics versus the MA stack.
As of March 26, 2026, ITOT (iShares Core S&P Total U.S. Stock Market ETF) is in a uptrend state on the monthly chart with 78% confidence. Monthly uptrend pulled back from ~$150 area on rising volume; price still well above rising EMA50/EMA100 and prior breakout zone.
On the monthly timeframe, ITOT has key support at $132 and key resistance at $150. The most likely scenario (bullish) targets $150 and $158, with a revert level at $136.
ITOT (iShares Core S&P Total U.S. Stock Market ETF) is currently classified as uptrend on the monthly chart, with 78% confidence. Confirmation requires: Monthly close back above $150 would confirm trend continuation (wave 5 extension/breakout). This would be invalidated by: Monthly close below $132 would raise odds of a deeper ABC correction (loss of recent swing support).
The most likely scenario (bullish) targets $150 and $158, with a revert level at $136. The alternative scenario (bearish) targets $136 and $118.
Multi-layer AI agents analyse 200+ stocks across daily, weekly, and monthly timeframes — producing market state classifications, price scenarios with targets, and position entry/exit levels. Updated every trading day after market close. No paywall. No sign-up required.
Built by Foliotrail.
All content on this website — including charts, analysis, price targets, support/resistance levels, and position zones — is generated entirely by AI and provided for educational and informational purposes only.
This is not financial advice. NEXUSNOIR VENTURES SL (the operator of this website) is not a registered investment adviser or broker-dealer. You should not make investment decisions based solely on this information. Always do your own research and consult a qualified financial advisor.
By continuing, you acknowledge that you have read and agree to our full disclaimer & terms of use and privacy policy.