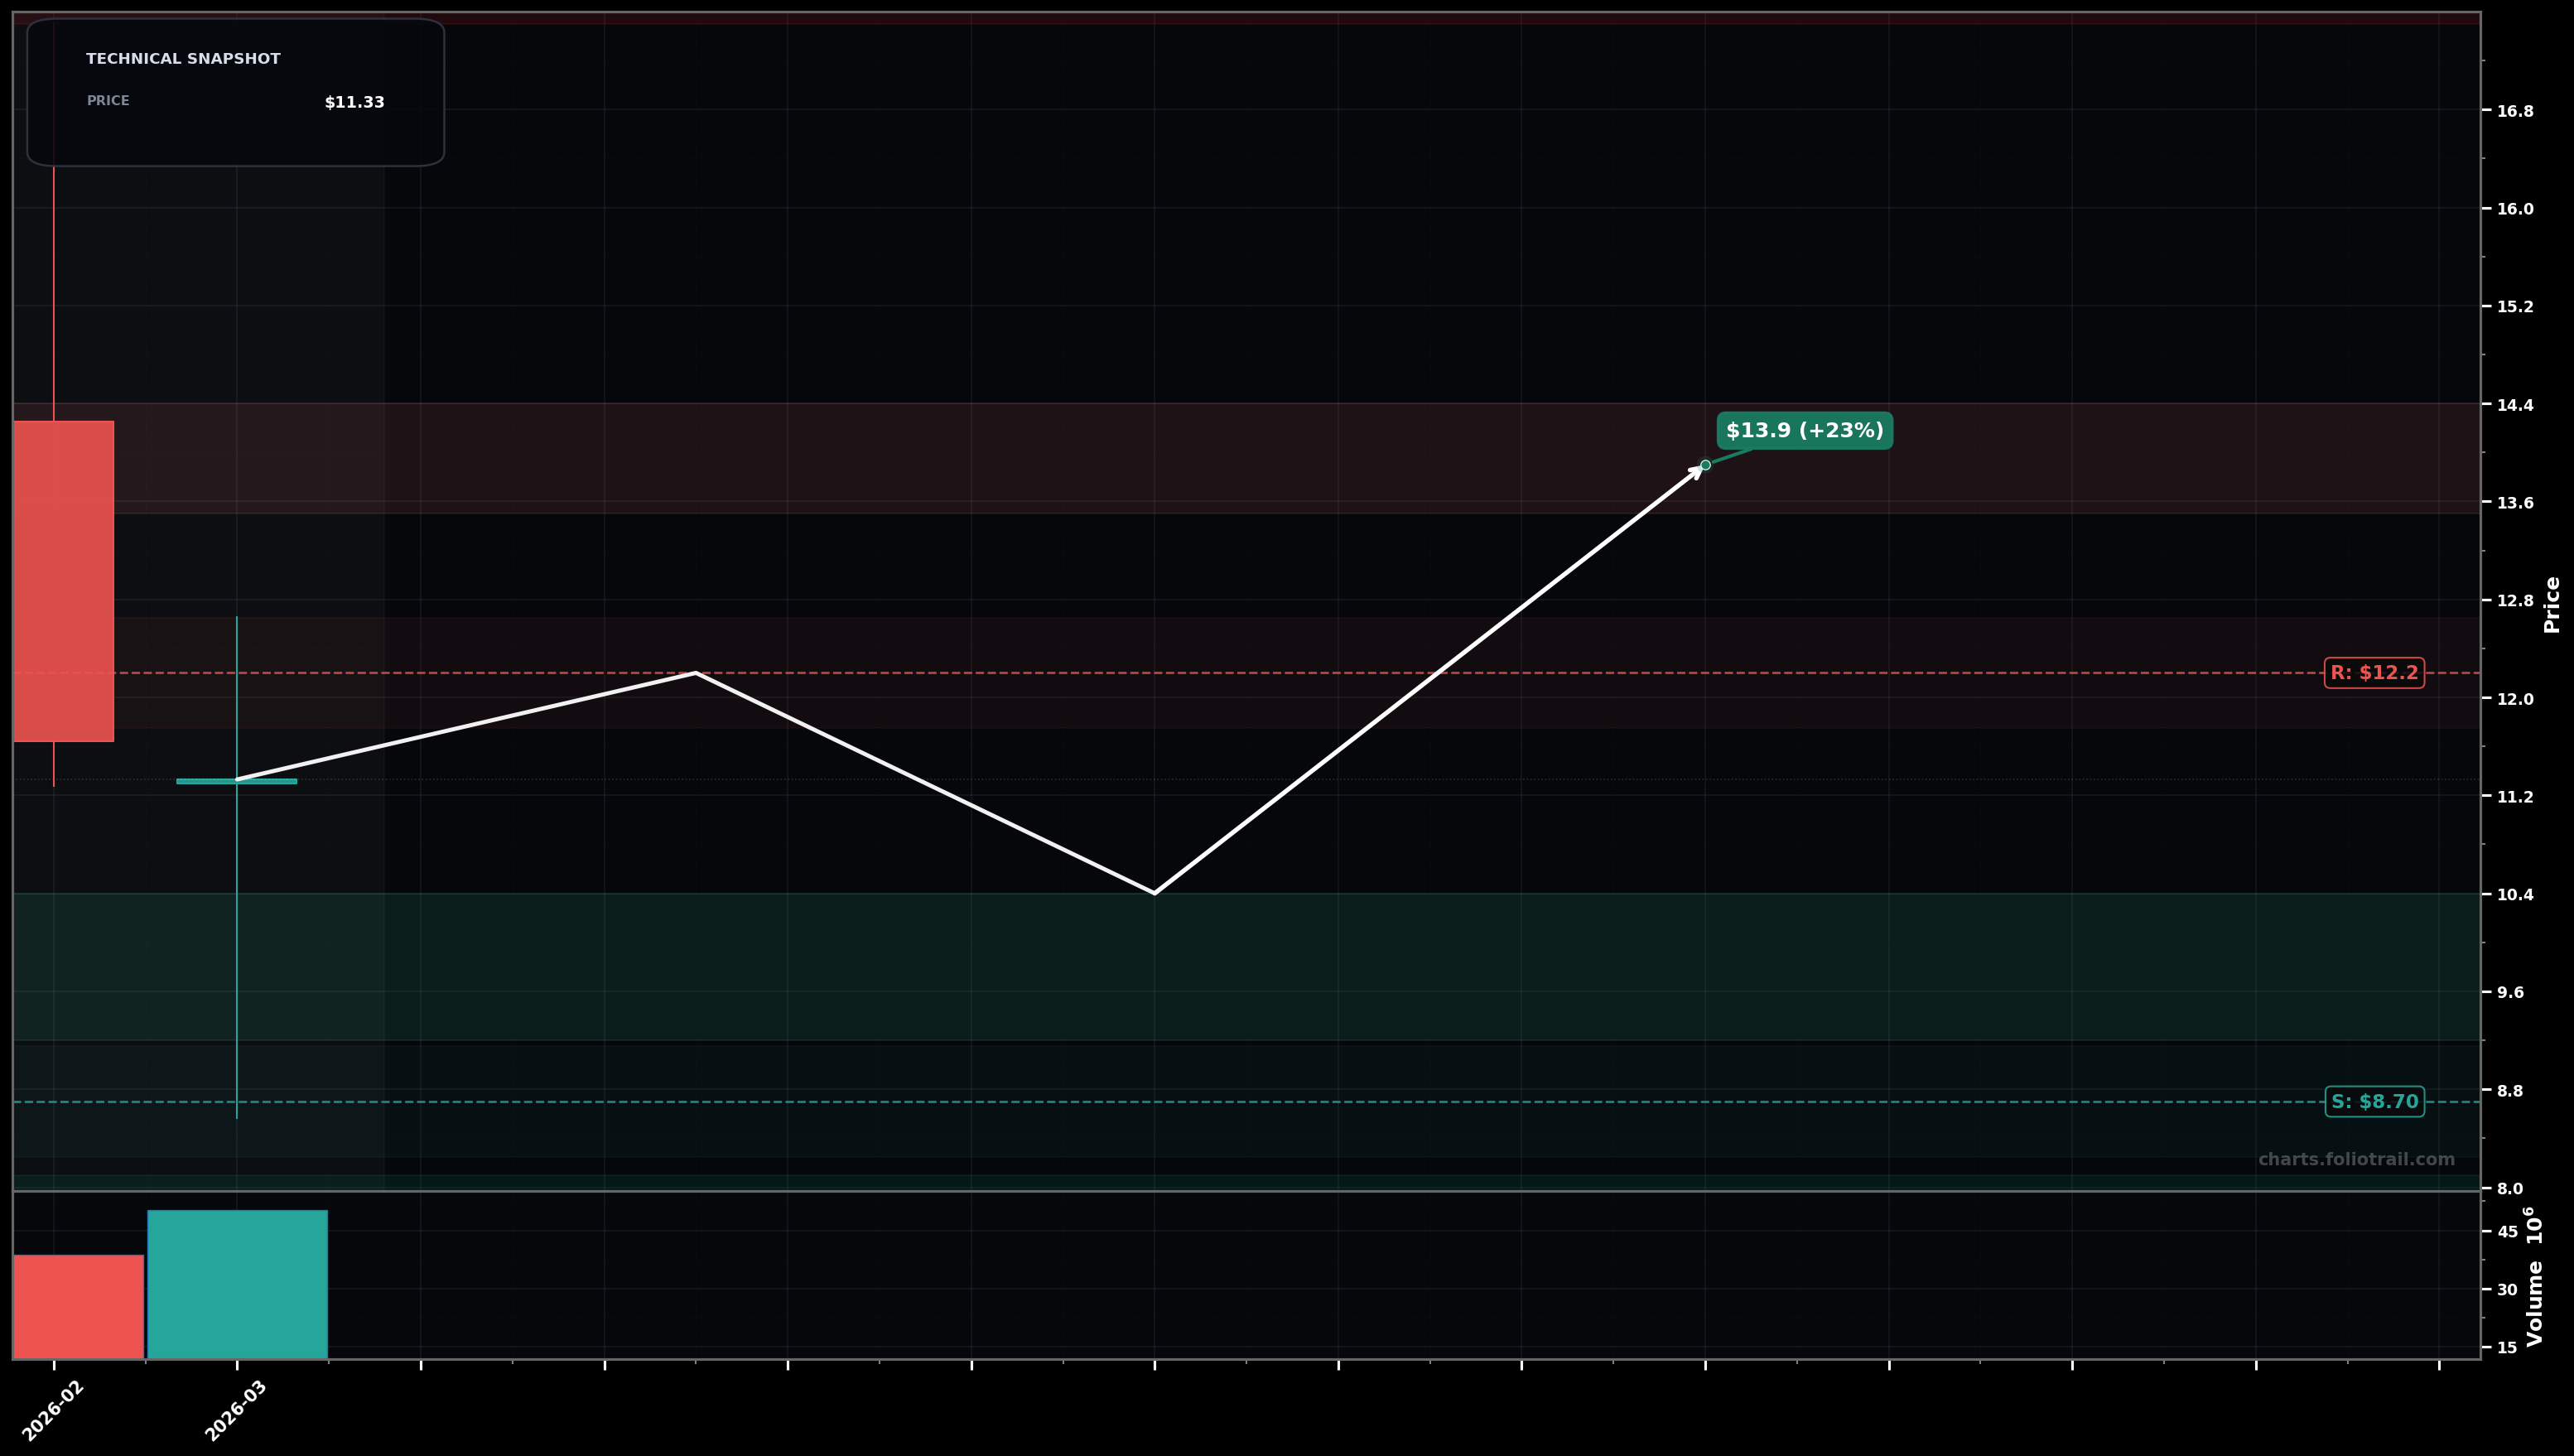
As of March 26, 2026, INFQ (Infleqtion Inc.) is in a bottoming attempt state on the monthly chart, with a confidence level of 56%. Key support is at $8.70 and key resistance at $12.2. Monthly candle shows a sharp selloff from ~$14 area into the low-$11s, followed by a high-volume doji/indecision month around ~$11.3 (potential stabilization after impulse down).
Base-building then mean-reversion bounce: price holds $8.7 and works back through $12.2, targeting prior breakdown supply near mid-$13s to low-$14s.
Bear continuation: the doji resolves down; a break of $8.7 triggers another impulse leg lower (Elliott-style Wave 3/5 continuation) before any durable base forms.
Monthly close back above ~$12.20 (and hold with a second close) would confirm a bounce phase
Monthly close below ~$8.70 would invalidate and reintroduce breakdown risk
Scale in near the swing-low support ($8.7) and deeper flush levels ($7.2) while keeping risk defined; prefer adds only if price stops making LL on the monthly.
Trim into prior breakdown supply and likely Fib retracement zones (first ~0.5–0.618 of the drop near $13.5–$14.4, then extension toward prior highs).
As of March 26, 2026, INFQ (Infleqtion Inc.) is in a bottoming attempt state on the monthly chart with 56% confidence. Monthly candle shows a sharp selloff from ~$14 area into the low-$11s, followed by a high-volume doji/indecision month around ~$11.3 (potential stabilization after impulse down).
On the monthly timeframe, INFQ has key support at $8.70 and key resistance at $12.2. The most likely scenario (bullish) targets $12.2 and $13.9, with a revert level at $10.4.
INFQ (Infleqtion Inc.) is currently classified as bottoming attempt on the monthly chart, with 56% confidence. Confirmation requires: Monthly close back above ~$12.20 (and hold with a second close) would confirm a bounce phase This would be invalidated by: Monthly close below ~$8.70 would invalidate and reintroduce breakdown risk
The most likely scenario (bullish) targets $12.2 and $13.9, with a revert level at $10.4. The alternative scenario (bearish) targets $8.70 and $7.20.
Multi-layer AI agents analyse 200+ stocks across daily, weekly, and monthly timeframes — producing market state classifications, price scenarios with targets, and position entry/exit levels. Updated every trading day after market close. No paywall. No sign-up required.
Built by Foliotrail.
All content on this website — including charts, analysis, price targets, support/resistance levels, and position zones — is generated entirely by AI and provided for educational and informational purposes only.
This is not financial advice. NEXUSNOIR VENTURES SL (the operator of this website) is not a registered investment adviser or broker-dealer. You should not make investment decisions based solely on this information. Always do your own research and consult a qualified financial advisor.
By continuing, you acknowledge that you have read and agree to our full disclaimer & terms of use and privacy policy.