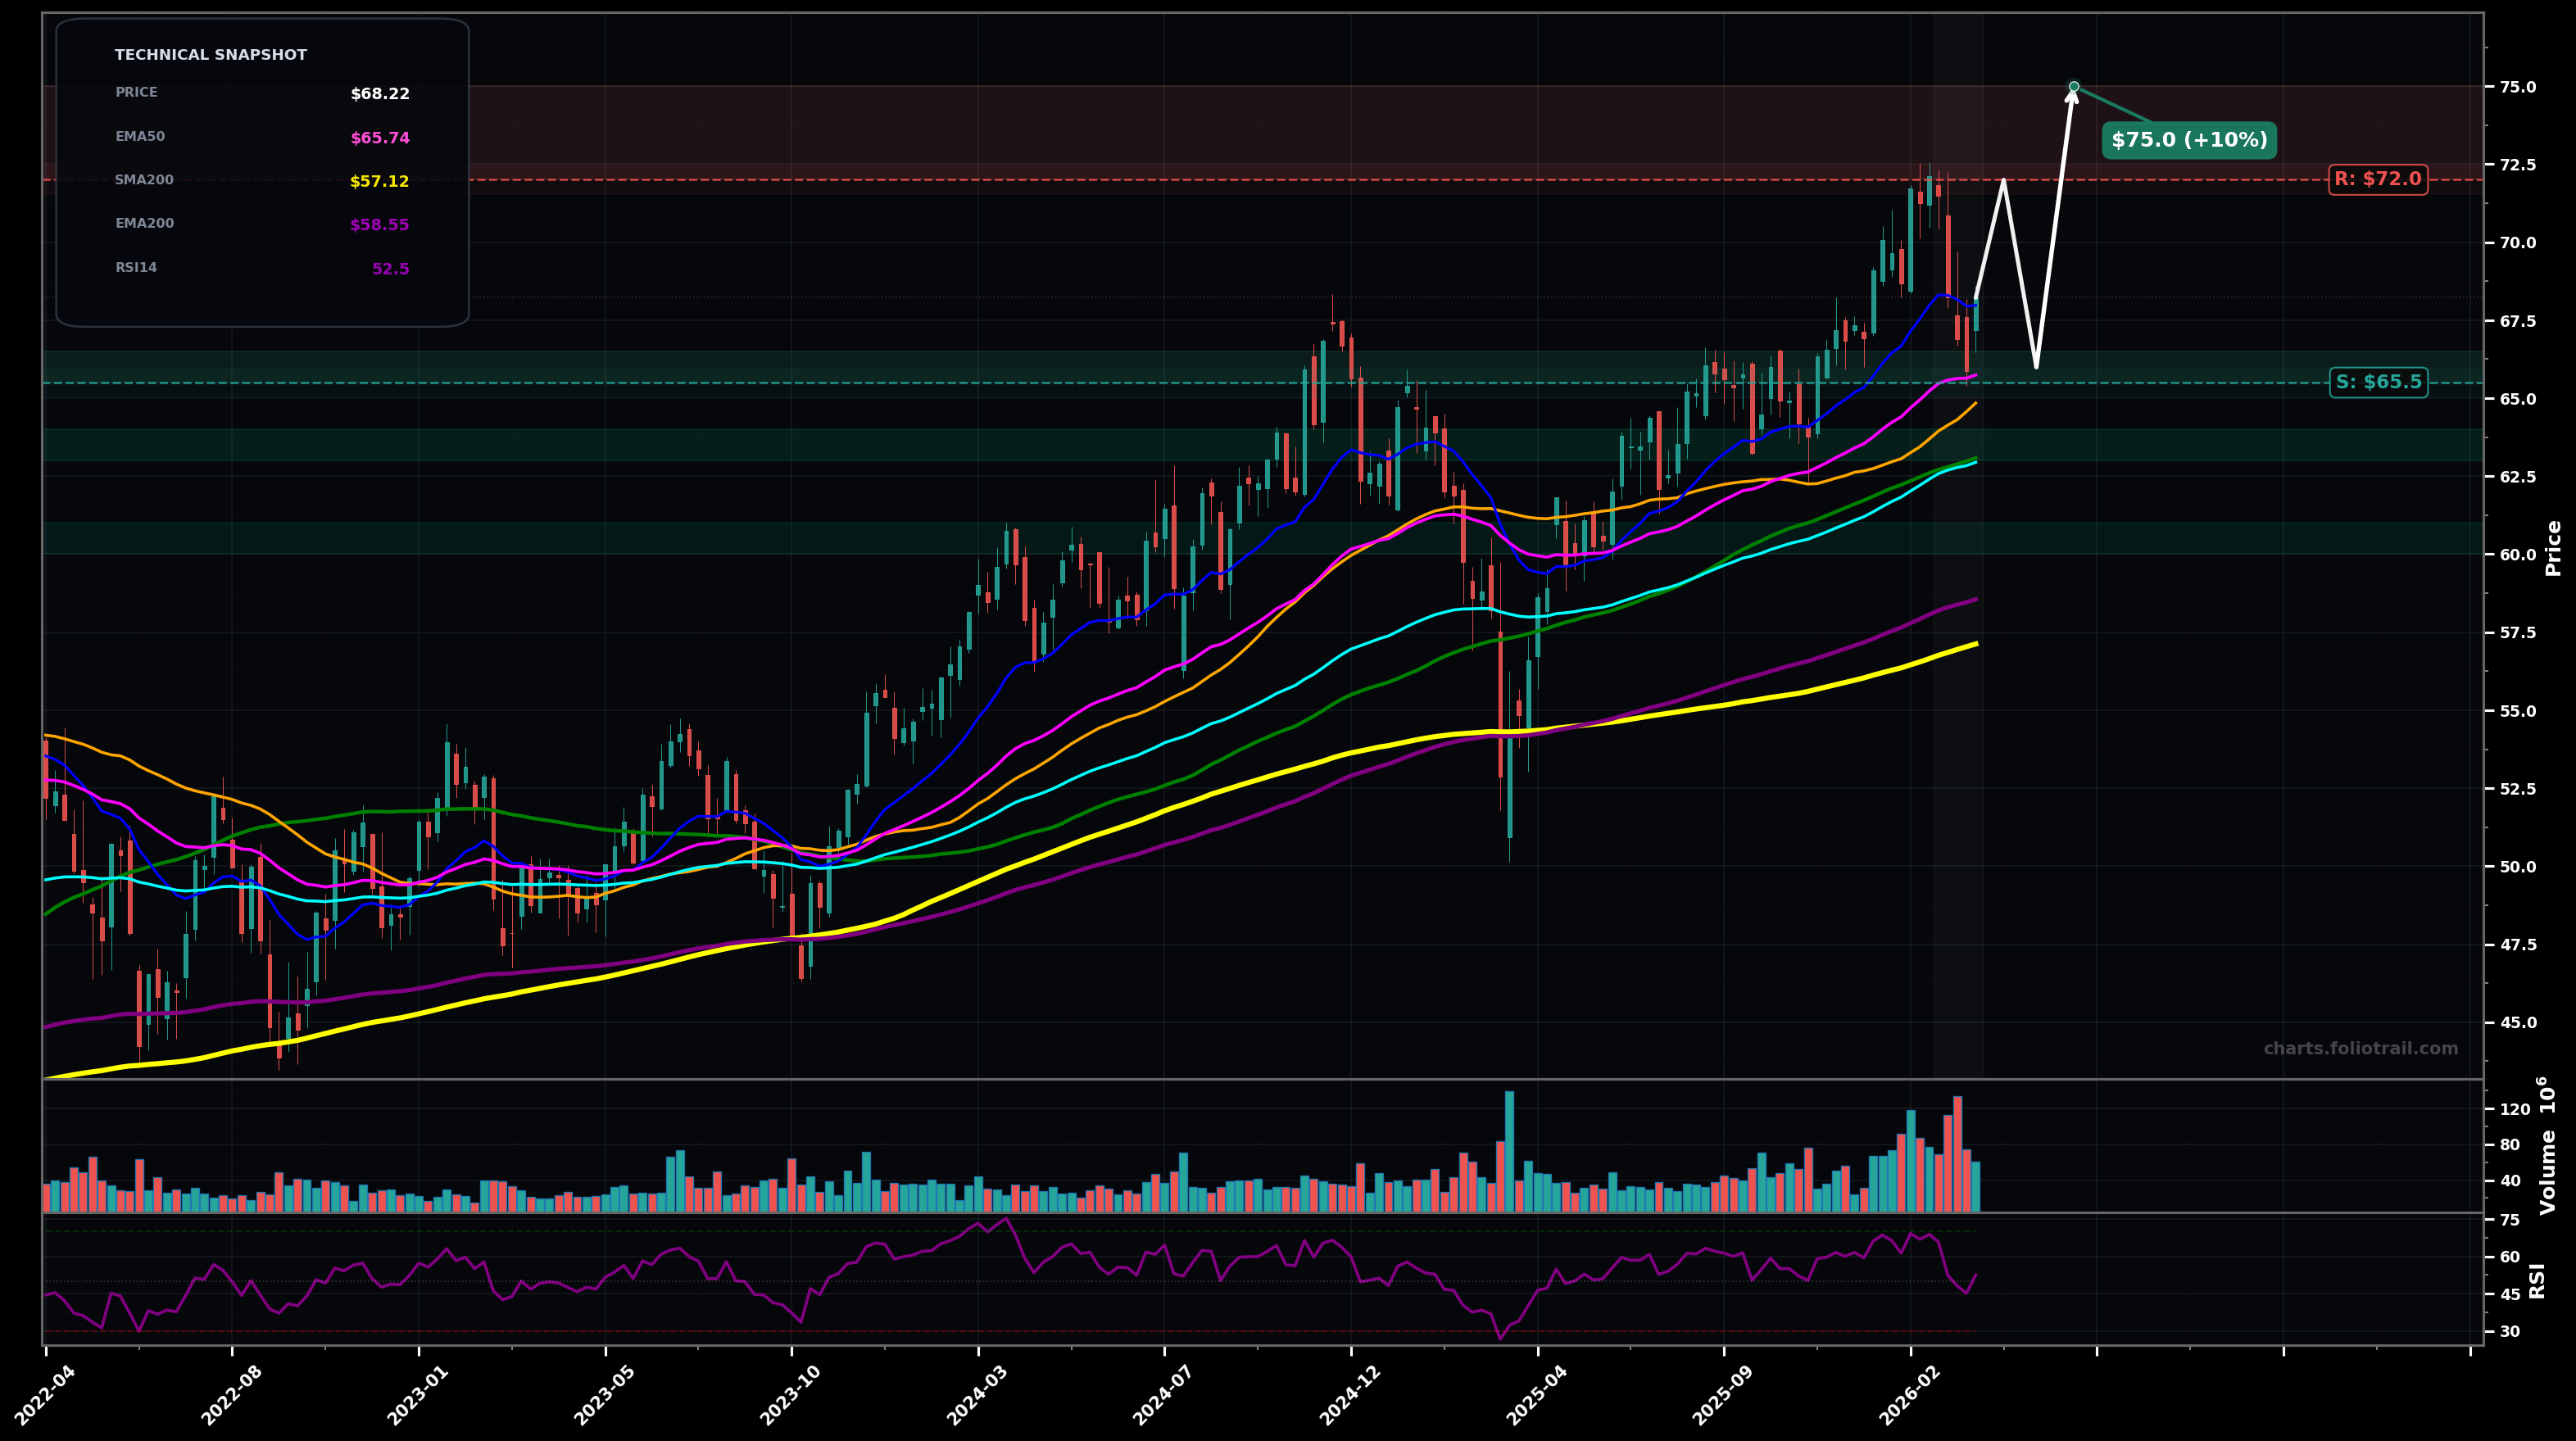
As of March 26, 2026, IJH (iShares Core S&P Mid-Cap ETF) is in a uptrend state on the weekly chart, with a confidence level of 72%. Key support is at $65.5 and key resistance at $72.0. Weekly pullback from ~$72 highs; price ~$68.22 holding above rising EMA50/EMA100 and above the prior breakout area around mid-$60s; RSI ~52 resetting from overbought.
Bullish continuation after a shallow consolidation: hold $65.5–$66 and push back through $70, then retest/clear the prior high zone. Elliott view: likely wave (4) pullback completed/near-complete, setting up wave (5) attempt.
Deeper corrective pullback into the rising MA cluster before buyers step in: lose $65.5, mean-revert toward $63 then potentially $60–$59 (EMA200 area). Elliott view: wave (4) extends into a larger ABC/complex correction; Fibonacci-style retrace of the $50->$72 leg could probe ~38.2% (~$63.5) and ~50% (~$61).
Weekly close back above $70.00 (and hold) to confirm trend continuation toward highs.
Weekly close below $65.50 (loss of EMA50 + breakdown of recent swing support) shifts bias to correction/base.
Scale-in at EMA50/support ($65.5–$66.5); add on 38.2% retrace/EMA100 area (~$63–$64); heavy add on 50% retrace + EMA200/major trend support (~$60–$61).
Trim into prior-high breakout/extension ($72–$75); heavier trims on upside extensions where price is stretched vs rising EMA50/100 ($75–$80); consider full exit on extreme multi-year stretch and sentiment/volume climax risk ($80–$85).
As of March 26, 2026, IJH (iShares Core S&P Mid-Cap ETF) is in a uptrend state on the weekly chart with 72% confidence. Weekly pullback from ~$72 highs; price ~$68.22 holding above rising EMA50/EMA100 and above the prior breakout area around mid-$60s; RSI ~52 resetting from overbought.
On the weekly timeframe, IJH has key support at $65.5 and key resistance at $72.0. The most likely scenario (bullish) targets $72.0 and $75.0, with a revert level at $66.0.
IJH (iShares Core S&P Mid-Cap ETF) is currently classified as uptrend on the weekly chart, with 72% confidence. Confirmation requires: Weekly close back above $70.00 (and hold) to confirm trend continuation toward highs. This would be invalidated by: Weekly close below $65.50 (loss of EMA50 + breakdown of recent swing support) shifts bias to correction/base.
The most likely scenario (bullish) targets $72.0 and $75.0, with a revert level at $66.0. The alternative scenario (bearish) targets $63.5 and $60.5.
Multi-layer AI agents analyse 200+ stocks across daily, weekly, and monthly timeframes — producing market state classifications, price scenarios with targets, and position entry/exit levels. Updated every trading day after market close. No paywall. No sign-up required.
Built by Foliotrail.
All content on this website — including charts, analysis, price targets, support/resistance levels, and position zones — is generated entirely by AI and provided for educational and informational purposes only.
This is not financial advice. NEXUSNOIR VENTURES SL (the operator of this website) is not a registered investment adviser or broker-dealer. You should not make investment decisions based solely on this information. Always do your own research and consult a qualified financial advisor.
By continuing, you acknowledge that you have read and agree to our full disclaimer & terms of use and privacy policy.