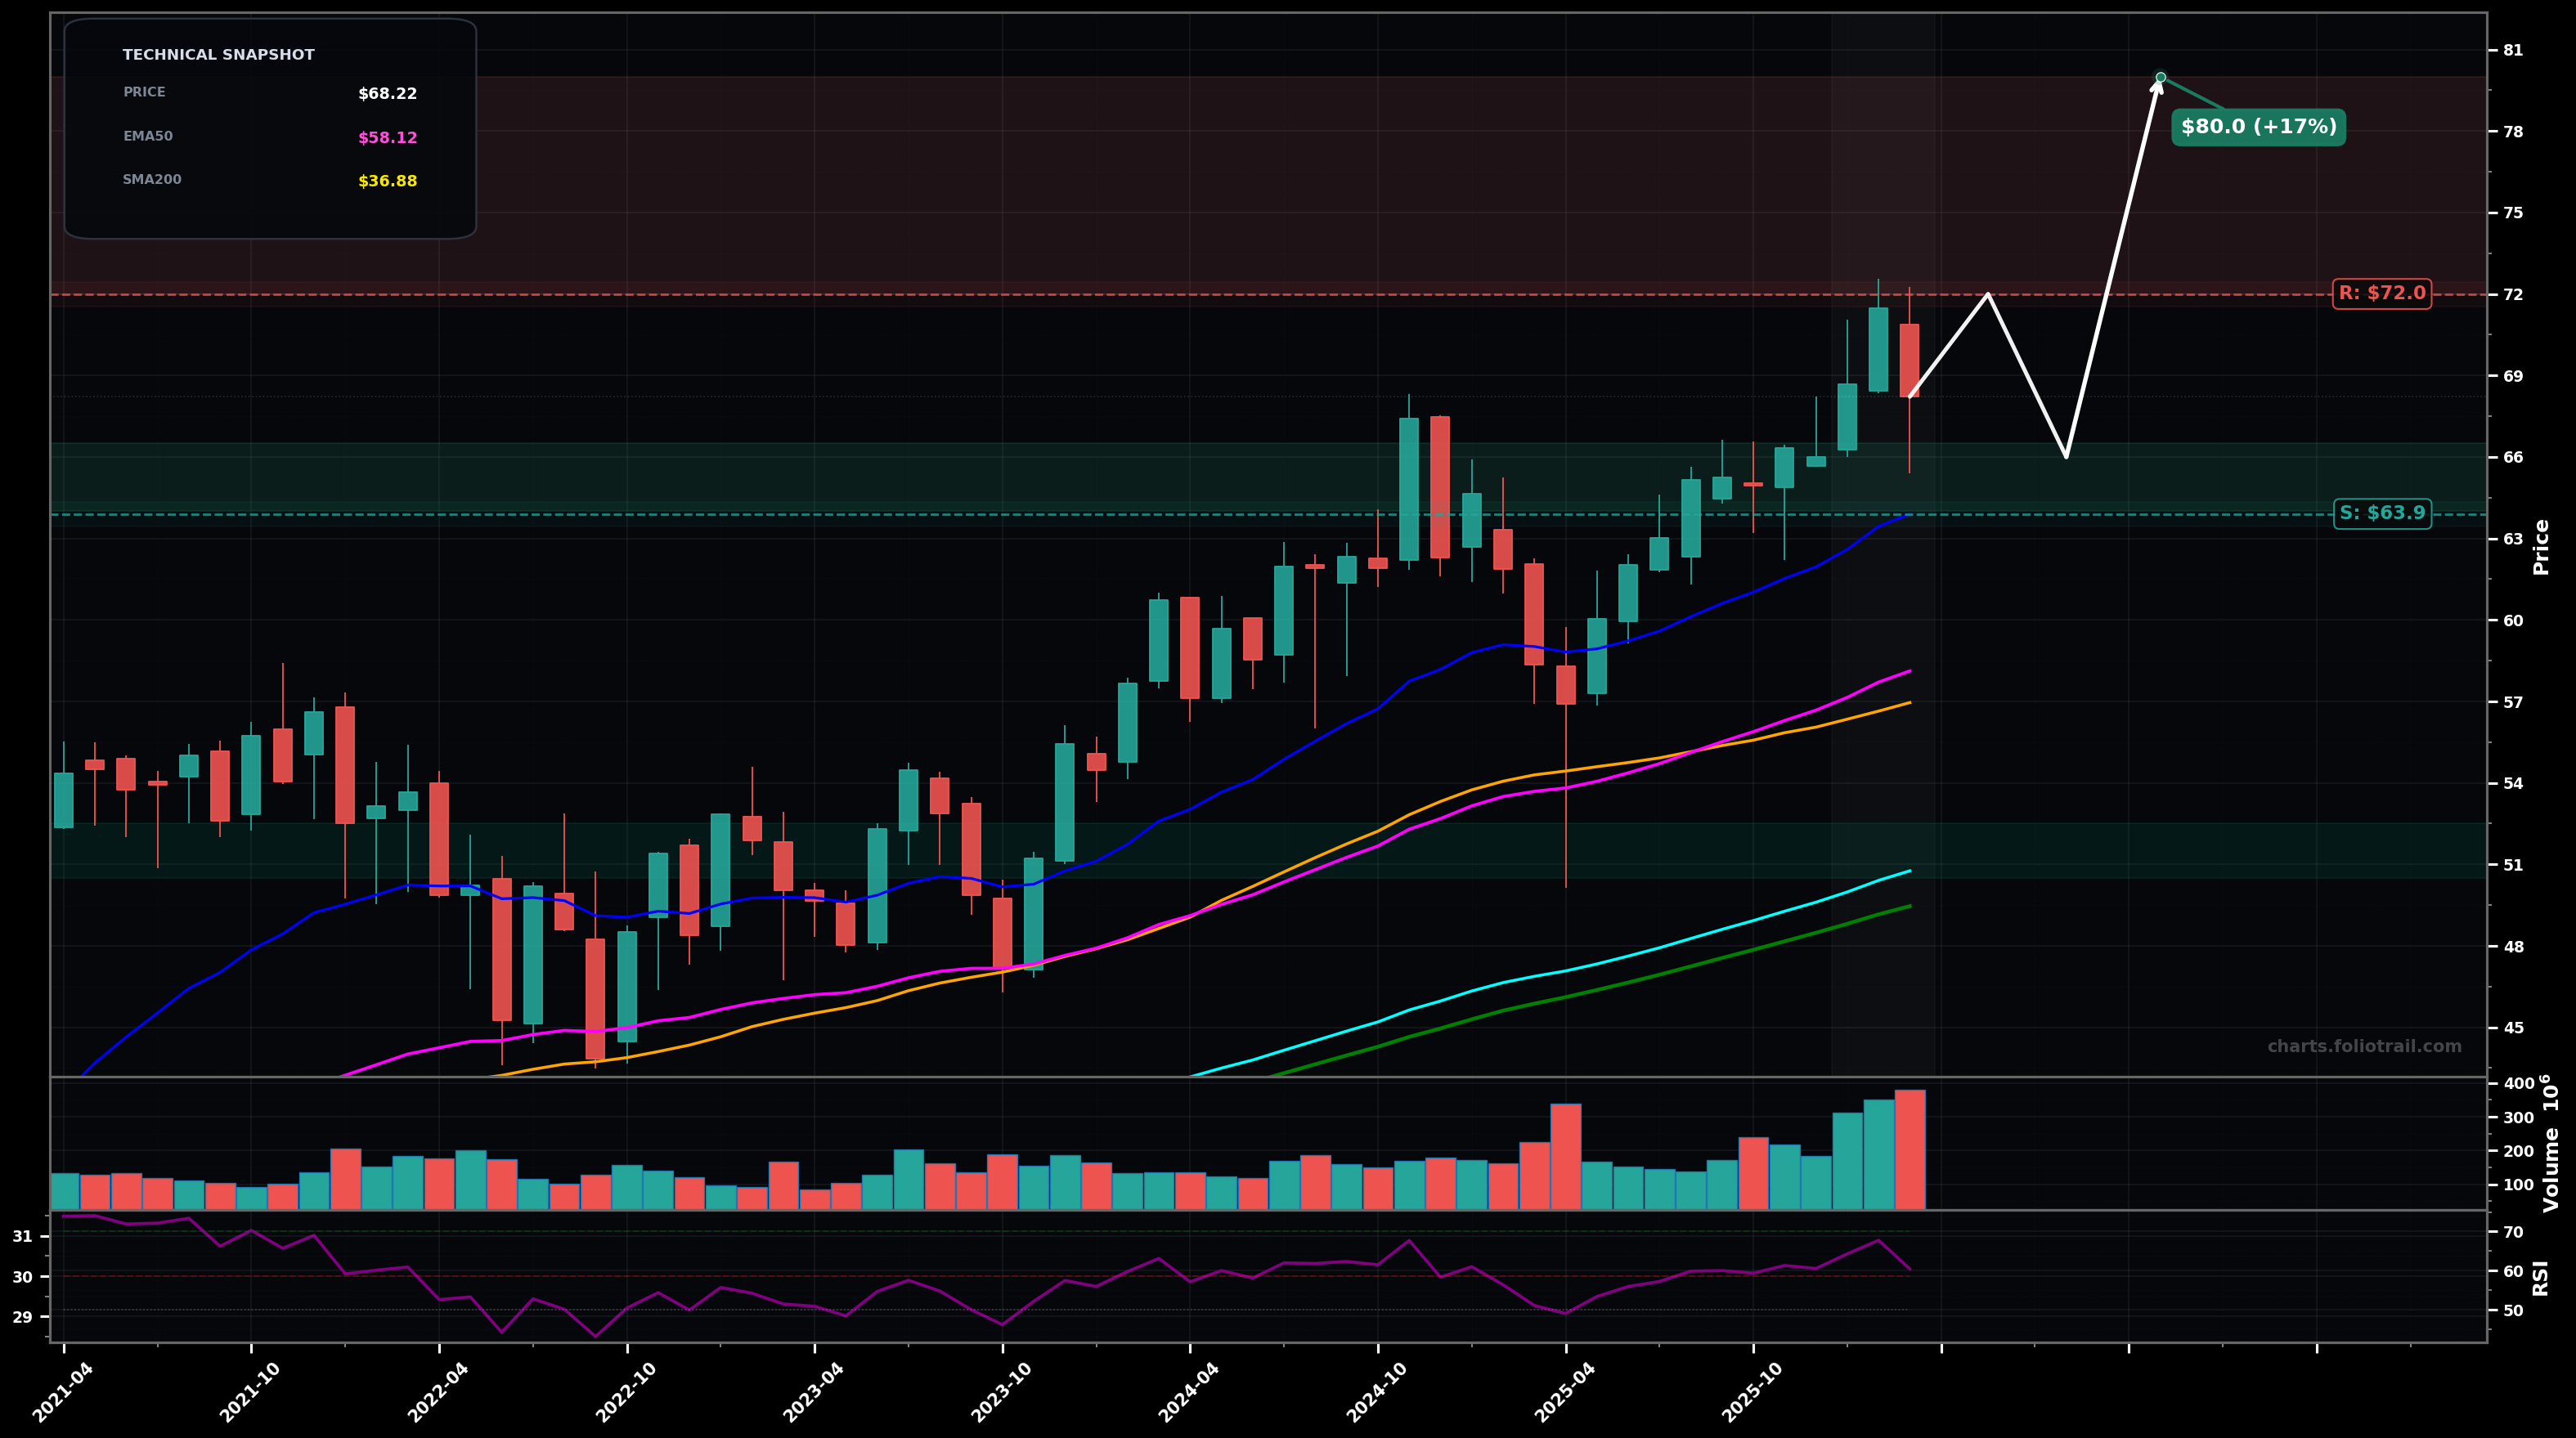
As of March 26, 2026, IJH (iShares Core S&P Mid-Cap ETF) is in a uptrend state on the monthly chart, with a confidence level of 76%. Key support is at $63.9 and key resistance at $72.0. Monthly uptrend; recent push to new swing high near $72 followed by a pullback to ~$68 on elevated volume while holding above rising EMA50/SMA50.
Bullish continuation: the current pullback acts as a wave-(4) style consolidation, then price resumes the primary uptrend (wave-(5)) and breaks to new highs.
Deeper corrective retracement: a multi-month ABC pulls price back toward the rising EMA50/SMA50 cluster before the longer-term uptrend attempts to reassert.
Monthly close above $72.00
Monthly close below $63.90 (EMA20 area / last impulse support)
Start near prior breakout/EMA20-50 support; add at EMA50/SMA50 confluence; heavy add only if a deeper fib-style retrace reaches EMA100 (~$50.8) while holding the long-term trend structure.
Trim into new highs (likely wave-(5) / extension) where price tends to stretch above EMA50; heavier trims on further extension; close if a multi-year overextension develops far above the major MAs.
As of March 26, 2026, IJH (iShares Core S&P Mid-Cap ETF) is in a uptrend state on the monthly chart with 76% confidence. Monthly uptrend; recent push to new swing high near $72 followed by a pullback to ~$68 on elevated volume while holding above rising EMA50/SMA50.
On the monthly timeframe, IJH has key support at $63.9 and key resistance at $72.0. The most likely scenario (bullish) targets $72.0 and $80.0, with a revert level at $66.0.
IJH (iShares Core S&P Mid-Cap ETF) is currently classified as uptrend on the monthly chart, with 76% confidence. Confirmation requires: Monthly close above $72.00 This would be invalidated by: Monthly close below $63.90 (EMA20 area / last impulse support)
The most likely scenario (bullish) targets $72.0 and $80.0, with a revert level at $66.0. The alternative scenario (bearish) targets $63.9 and $58.1.
Multi-layer AI agents analyse 200+ stocks across daily, weekly, and monthly timeframes — producing market state classifications, price scenarios with targets, and position entry/exit levels. Updated every trading day after market close. No paywall. No sign-up required.
Built by Foliotrail.
All content on this website — including charts, analysis, price targets, support/resistance levels, and position zones — is generated entirely by AI and provided for educational and informational purposes only.
This is not financial advice. NEXUSNOIR VENTURES SL (the operator of this website) is not a registered investment adviser or broker-dealer. You should not make investment decisions based solely on this information. Always do your own research and consult a qualified financial advisor.
By continuing, you acknowledge that you have read and agree to our full disclaimer & terms of use and privacy policy.