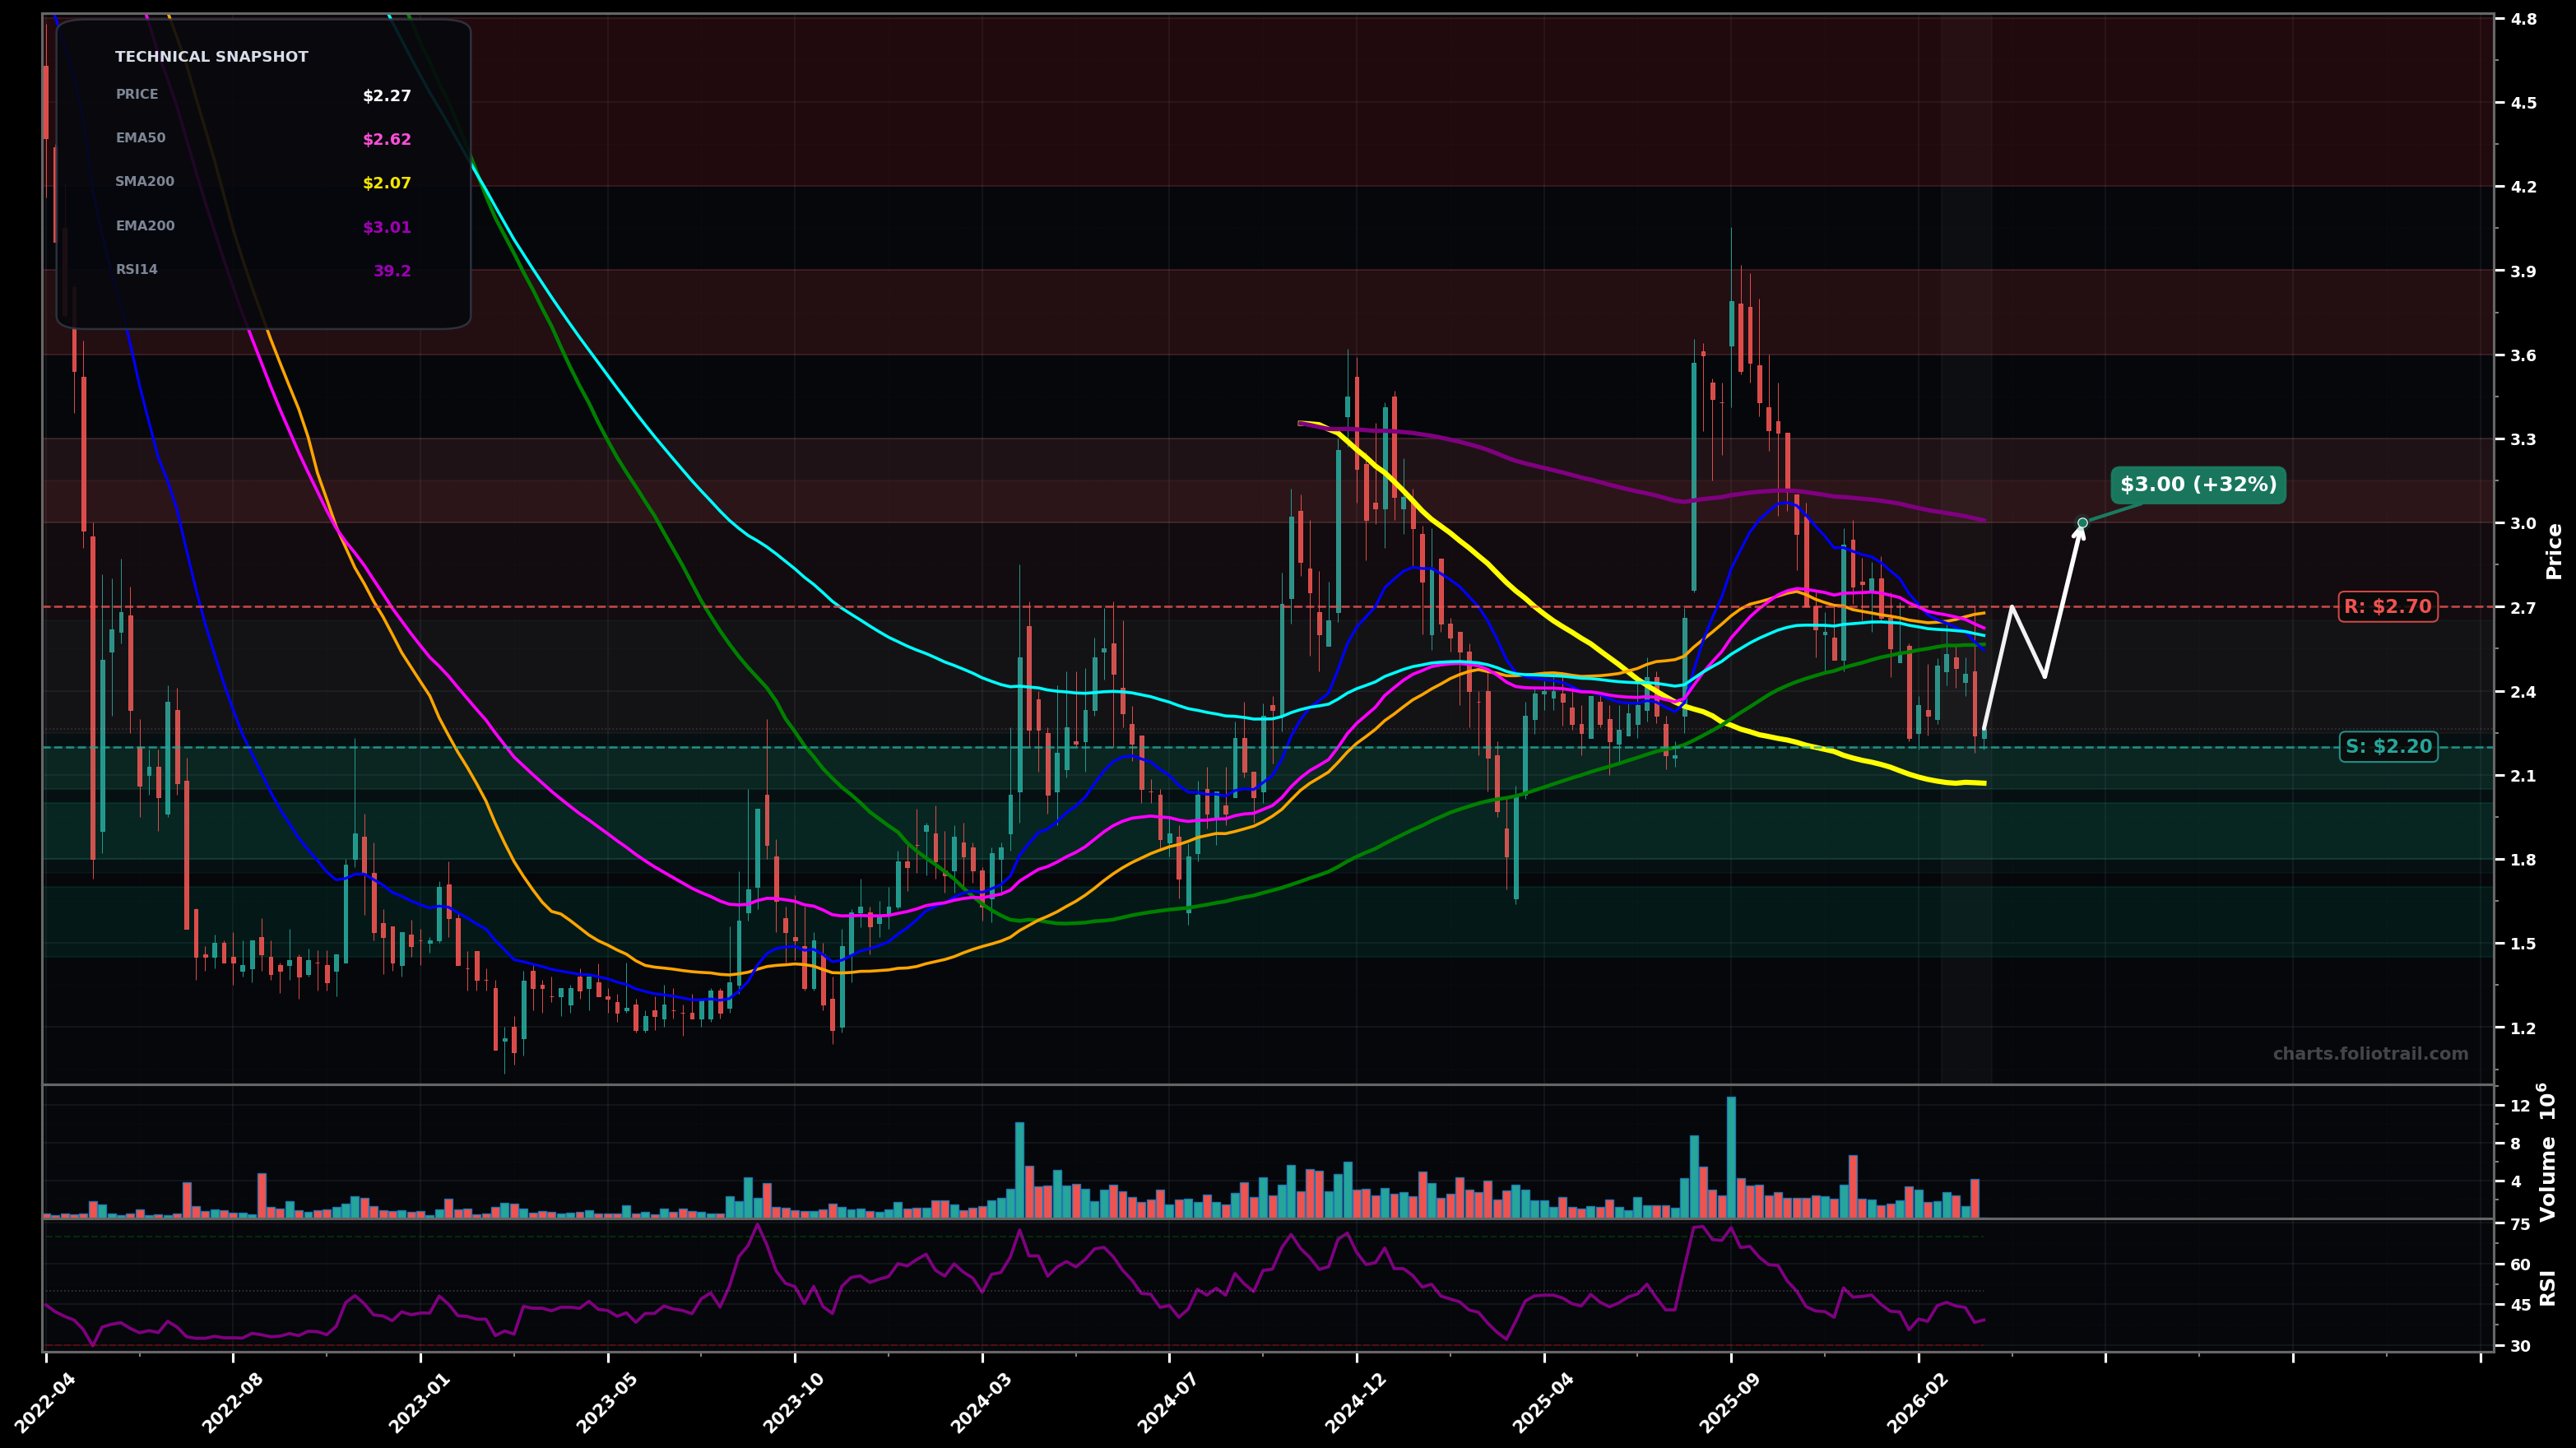
As of March 24, 2026, HITI (High Tide Inc.) is in a downtrend state on the weekly chart, with a confidence level of 63%. Key support is at $2.20 and key resistance at $2.70. Weekly price (~$2.27) is sliding after a failed push above the clustered 50/100-day MAs; RSI (~39) weak and candles drifting back toward the prior support shelf.
Base-building attempt: price holds the $2.20 swing support and mean-reverts toward the MA cluster; if accepted above it, a follow-through push targets the next supply zone.
Continuation lower: loss of $2.20 triggers a sweep toward the next demand pocket near the long-term average/support; any bounce likely retests breakdown before another leg down.
Weekly close below $2.20 (breaks the current swing-low zone) would confirm trend continuation
Two consecutive weekly closes back above $2.70 would invalidate the active downtrend bias (reclaim MA cluster)
Start near prior pivot + SMA200 (~$2.07) confluence; add on breakdown/flush to next demand; heavy add only if capitulation into the deeper 2023 base area.
Trim into prior swing supply and potential Fib retracement zone; heavier trims near the prior peak; close if price becomes extended above major MAs into long-term resistance.
As of March 24, 2026, HITI (High Tide Inc.) is in a downtrend state on the weekly chart with 63% confidence. Weekly price (~$2.27) is sliding after a failed push above the clustered 50/100-day MAs; RSI (~39) weak and candles drifting back toward the prior support shelf.
On the weekly timeframe, HITI has key support at $2.20 and key resistance at $2.70. The most likely scenario (bullish) targets $2.70 and $3.00, with a revert level at $2.45.
HITI (High Tide Inc.) is currently classified as downtrend on the weekly chart, with 63% confidence. Confirmation requires: Weekly close below $2.20 (breaks the current swing-low zone) would confirm trend continuation This would be invalidated by: Two consecutive weekly closes back above $2.70 would invalidate the active downtrend bias (reclaim MA cluster)
The most likely scenario (bullish) targets $2.70 and $3.00, with a revert level at $2.45. The alternative scenario (bearish) targets $2.07 and $1.80.
All content on this website — including charts, analysis, price targets, support/resistance levels, and position zones — is generated entirely by AI and provided for educational and informational purposes only.
This is not financial advice. NEXUSNOIR VENTURES SL (the operator of this website) is not a registered investment adviser or broker-dealer. You should not make investment decisions based solely on this information. Always do your own research and consult a qualified financial advisor.
By continuing, you acknowledge that you have read and agree to our full disclaimer & terms of use and privacy policy.