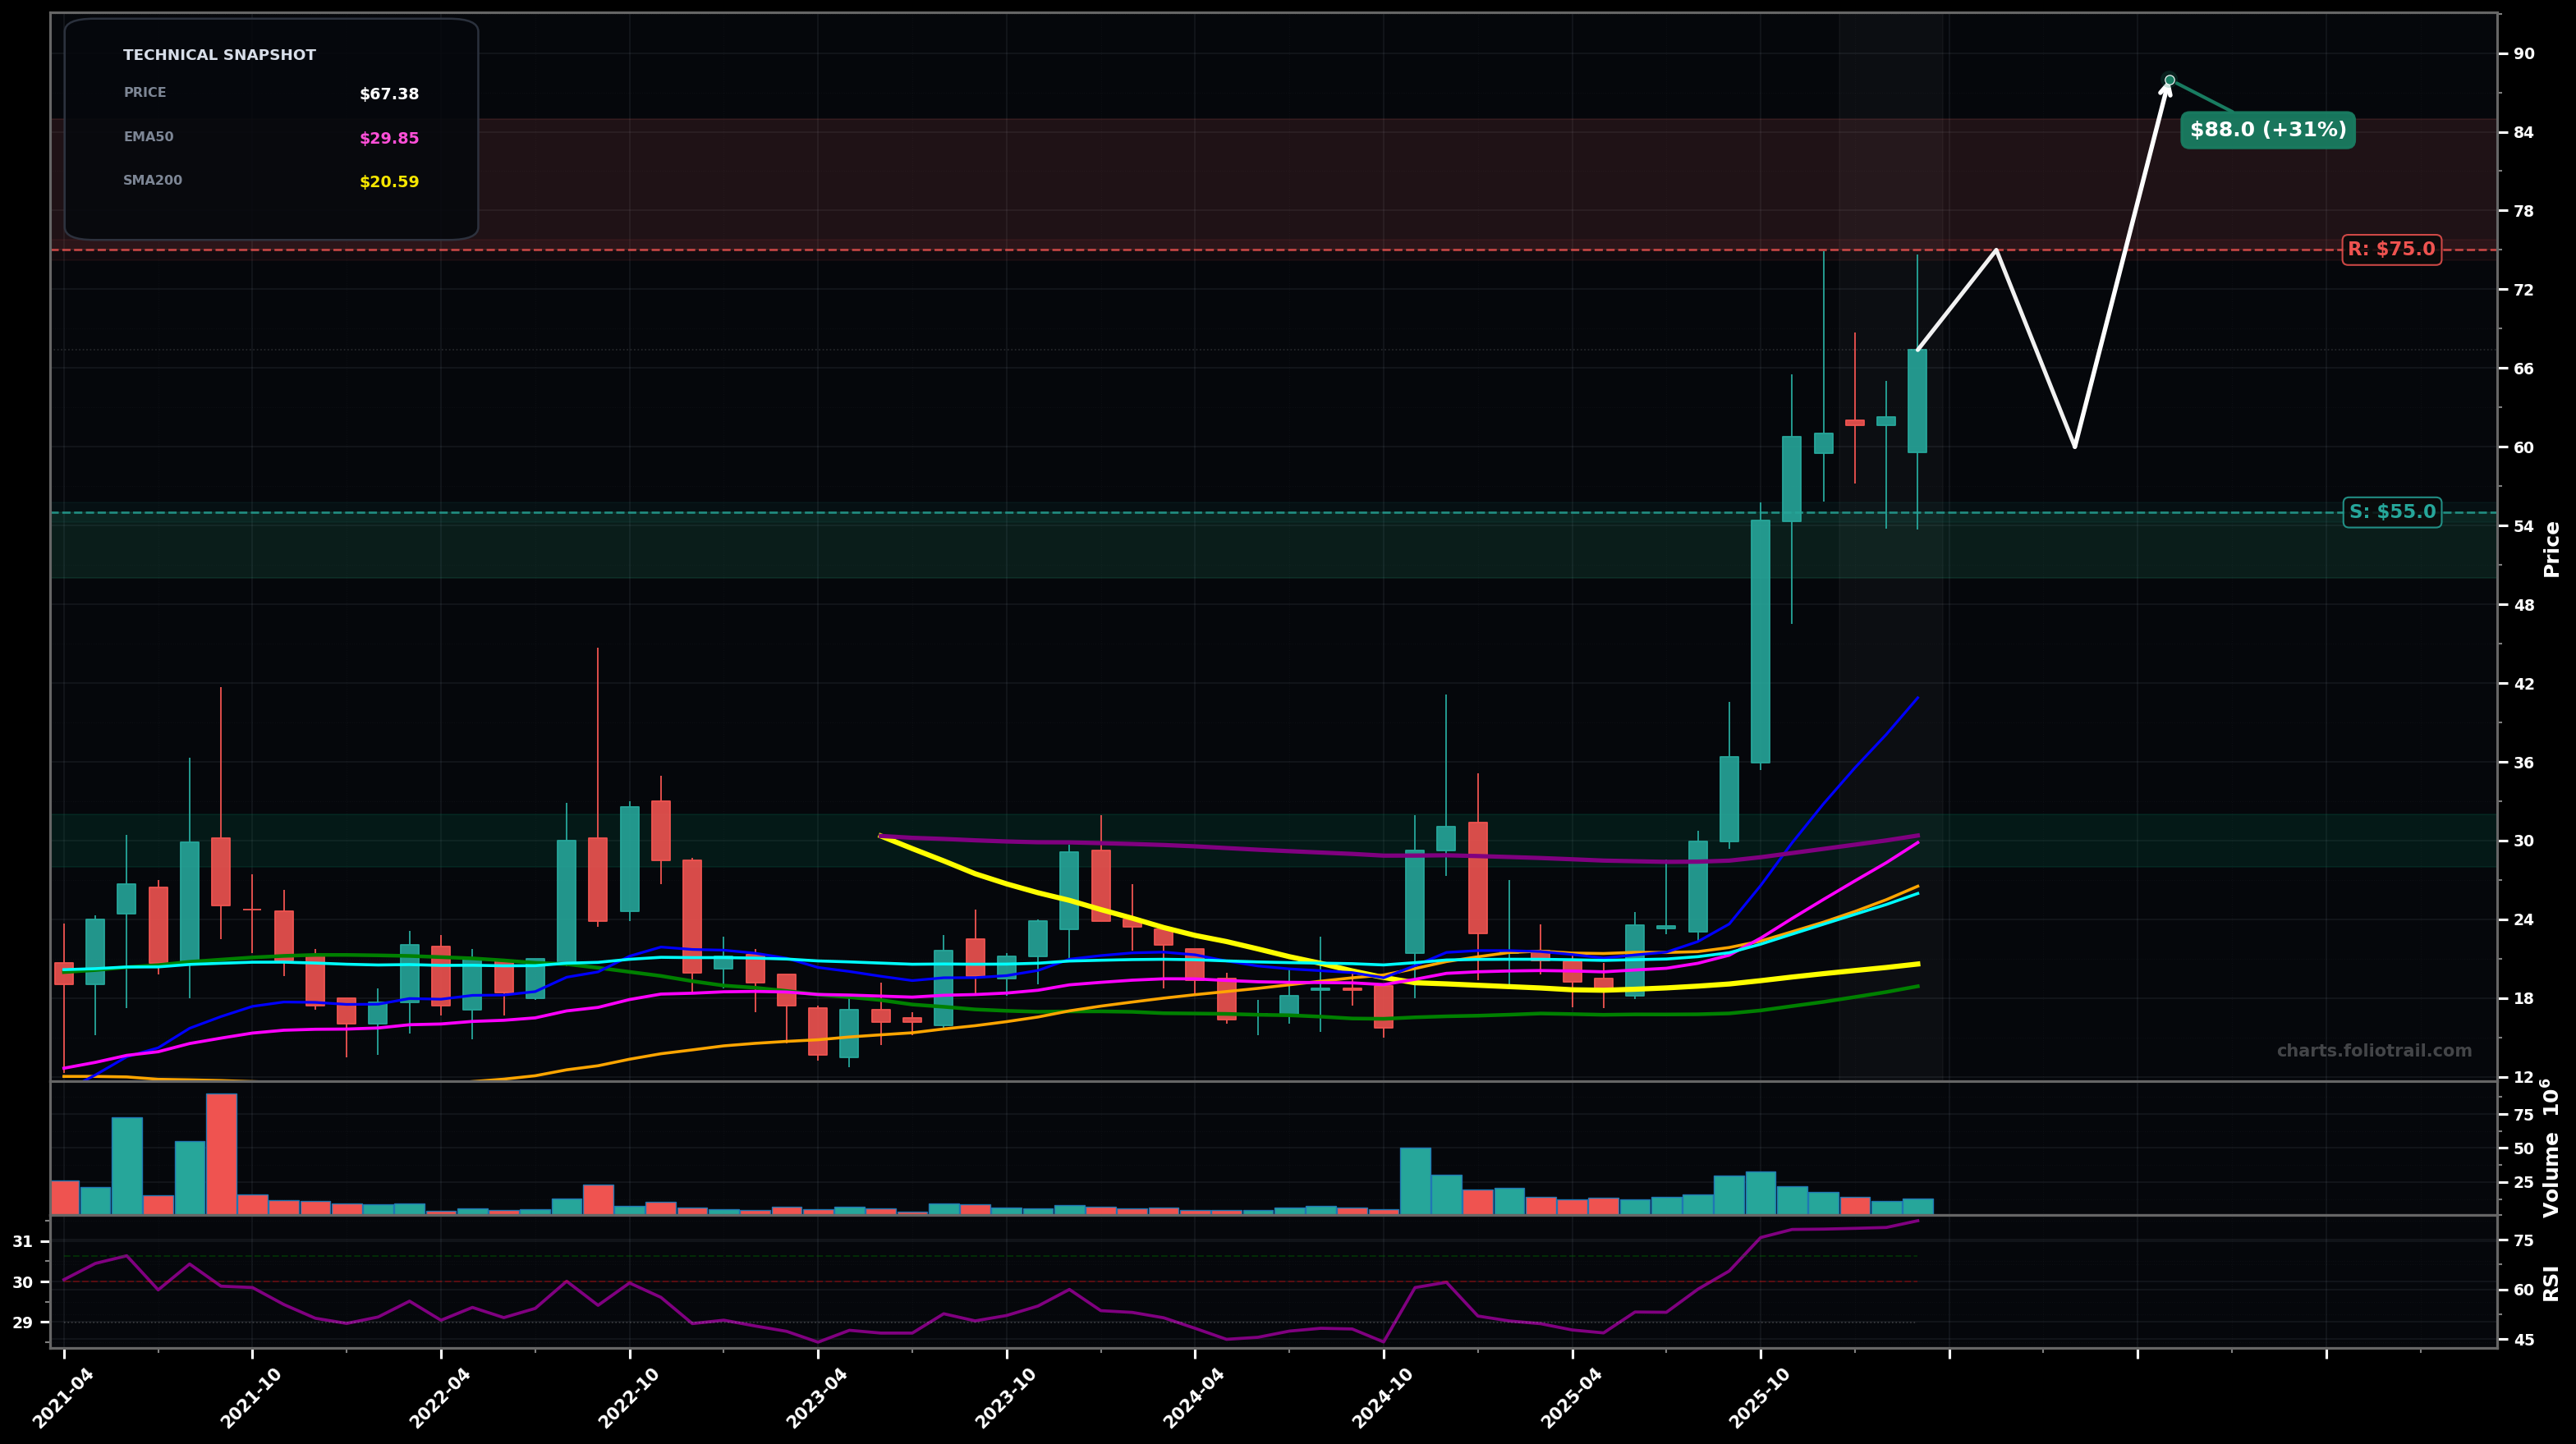
As of March 26, 2026, GSAT (Globalstar, Inc.) is in a parabolic state on the monthly chart, with a confidence level of 78%. Key support is at $55.0 and key resistance at $75.0. Strong monthly breakout and vertical run from the $20s into the high $60s; momentum extreme (RSI ~80.7) with price far above all major MAs.
Parabolic extension continues (Elliott: likely Wave 3 still pushing, or a Wave 5 blow-off) with a push into the $70s before a sharp pullback/consolidation; Fibonacci-style mean reversion risk rises as price is far from EMA50 (~$29.9).
Blow-off top forms and a deeper monthly retrace begins (Elliott: Wave 4 correction if trend remains intact, or start of A-B-C if the move was a completed 5-wave impulse) targeting the prior breakout area and rising MA cluster; volatility likely elevated.
Monthly close above $68.00 with follow-through toward $75.00+
Monthly close below $55.00 (loss of the most recent breakout base/impulse support)
Buy-the-dip zones align with prior breakout/support ($50–$55) then a deeper Wave-4/A leg retrace into the big MA cluster (EMA50/100/200 ~$26–$30) where trend support should be strongest.
As price extends further above the long-term MAs and RSI stays extreme, odds of a sharp mean-reversion rise; trim into extensions (likely late Wave 3/Wave 5) and fully exit if a euphoric overshoot occurs.
As of March 26, 2026, GSAT (Globalstar, Inc.) is in a parabolic state on the monthly chart with 78% confidence. Strong monthly breakout and vertical run from the $20s into the high $60s; momentum extreme (RSI ~80.7) with price far above all major MAs.
On the monthly timeframe, GSAT has key support at $55.0 and key resistance at $75.0. The most likely scenario (bullish) targets $75.0 and $88.0, with a revert level at $60.0.
GSAT (Globalstar, Inc.) is currently classified as parabolic on the monthly chart, with 78% confidence. Confirmation requires: Monthly close above $68.00 with follow-through toward $75.00+ This would be invalidated by: Monthly close below $55.00 (loss of the most recent breakout base/impulse support)
The most likely scenario (bullish) targets $75.0 and $88.0, with a revert level at $60.0. The alternative scenario (bearish) targets $50.0 and $30.0.
Multi-layer AI agents analyse 200+ stocks across daily, weekly, and monthly timeframes — producing market state classifications, price scenarios with targets, and position entry/exit levels. Updated every trading day after market close. No paywall. No sign-up required.
Built by Foliotrail.
All content on this website — including charts, analysis, price targets, support/resistance levels, and position zones — is generated entirely by AI and provided for educational and informational purposes only.
This is not financial advice. NEXUSNOIR VENTURES SL (the operator of this website) is not a registered investment adviser or broker-dealer. You should not make investment decisions based solely on this information. Always do your own research and consult a qualified financial advisor.
By continuing, you acknowledge that you have read and agree to our full disclaimer & terms of use and privacy policy.