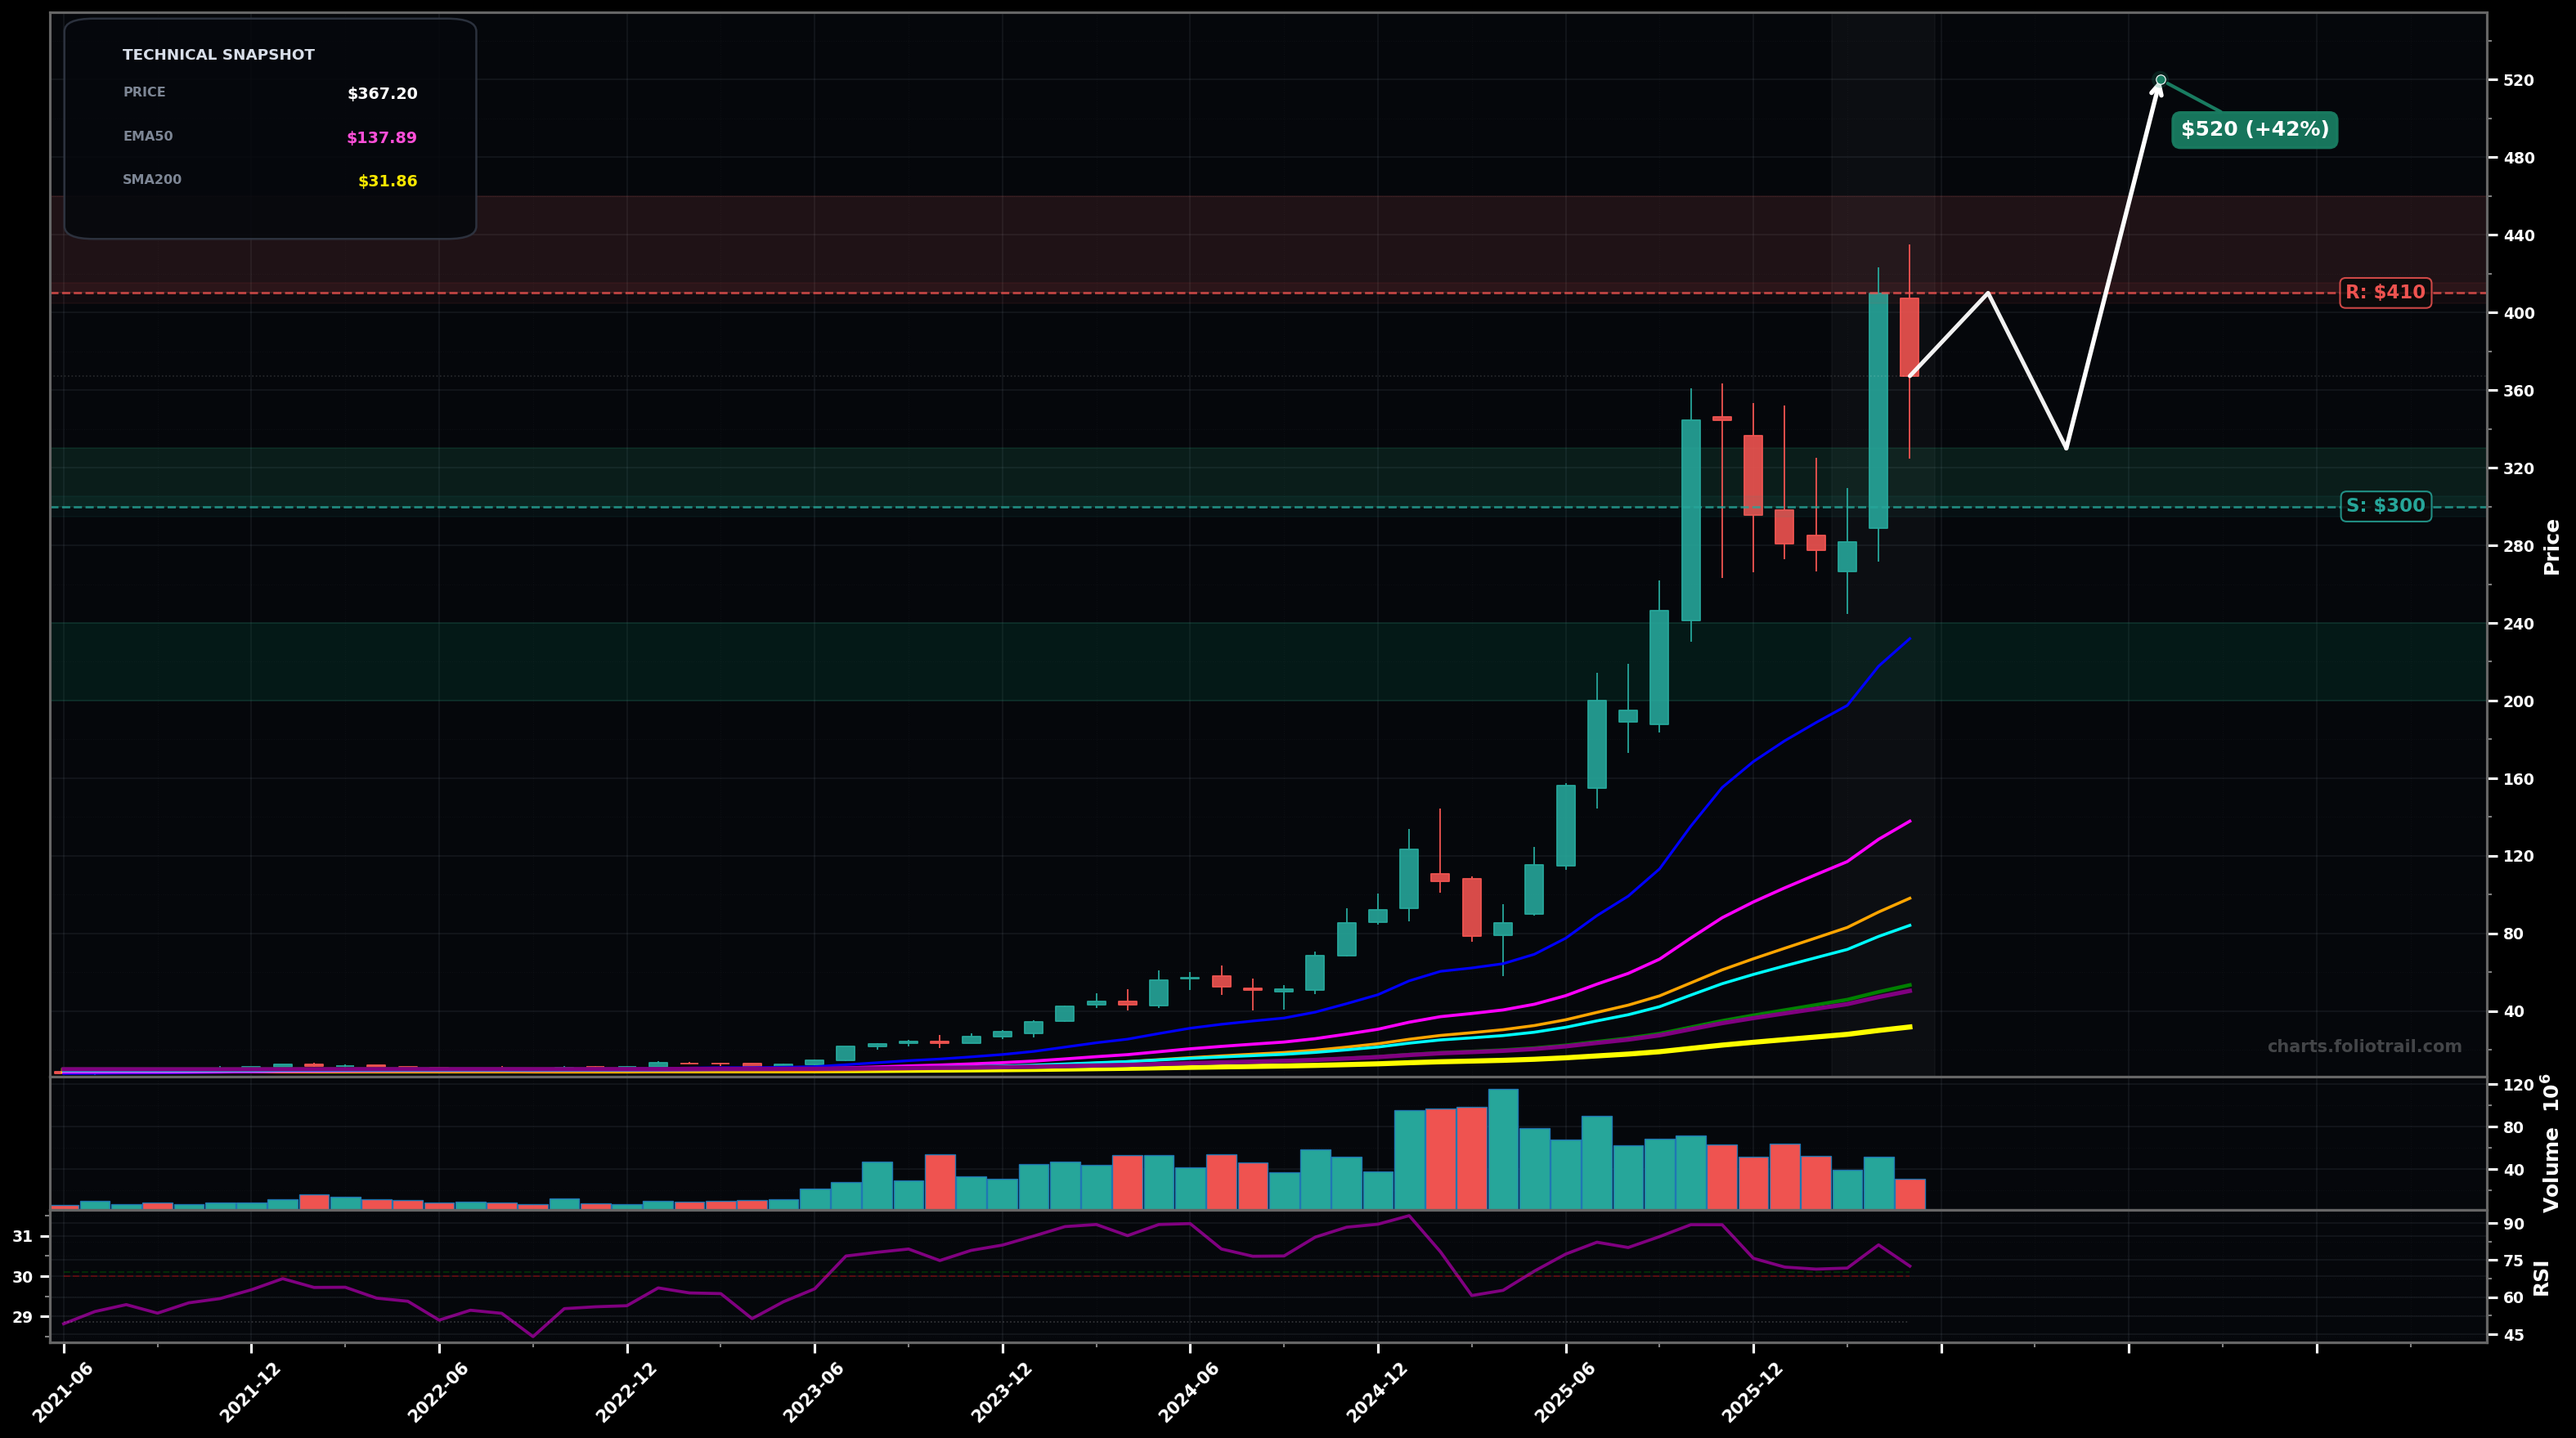
As of May 22, 2026, CLS (Celestica Inc.) is in a parabolic state on the monthly chart, with a confidence level of 72%. Key support is at $300 and key resistance at $410. After a strong impulse to new highs near $410, the latest month pulled back to ~$367 with a long lower wick (dip-buying) while still far above rising EMAs; RSI(14) ~72 remains overheated.
Bullish continuation after a shallow digestion: price holds $300–$330, then retests $410 and can extend to a measured move toward the low $400s/$500 area (parabolic continuation, but higher volatility). Rough probability ~60%.
Mean-reversion / wave-4 style correction: failure to reclaim $390–$410 leads to a larger pullback toward the rising trend/EMA20 area, with a possible wick into the mid-$200s before a base. Rough probability ~40%.
Monthly close above $410 followed by another close holding above $390
Monthly close below $300 (breaks the most recent consolidation floor and implies a deeper mean-reversion leg)
Use the prior breakout/swing structure ($300 area) first, then add on a deeper fib/structure pullback ($270–$300), and deploy heavier into a likely wave-4 capitulation/EMA20-mean-reversion zone ($200–$240).
Trim into prior high supply ($410+) and fib-extension territory ($520–$600); fully exit if price reaches extreme multi-year extension where monthly ranges typically signal cycle blow-off ($650–$750).
As of May 22, 2026, CLS (Celestica Inc.) is in a parabolic state on the monthly chart with 72% confidence. After a strong impulse to new highs near $410, the latest month pulled back to ~$367 with a long lower wick (dip-buying) while still far above rising EMAs; RSI(14) ~72 remains overheated.
On the monthly timeframe, CLS has key support at $300 and key resistance at $410. The most likely scenario (bullish) targets $410 and $520, with a revert level at $330.
CLS (Celestica Inc.) is currently classified as parabolic on the monthly chart, with 72% confidence. Confirmation requires: Monthly close above $410 followed by another close holding above $390 This would be invalidated by: Monthly close below $300 (breaks the most recent consolidation floor and implies a deeper mean-reversion leg)
The most likely scenario (bullish) targets $410 and $520, with a revert level at $330. The alternative scenario (bearish) targets $270 and $200.
Multi-layer AI agents analyse 200+ stocks across daily, weekly, and monthly timeframes — producing market state classifications, price scenarios with targets, and position entry/exit levels. Daily charts updated every trading day at 6 PM ET. Weekly charts refresh Fridays. Monthly charts refresh on the last trading day of each month. No paywall. No sign-up required.
Built by Foliotrail.
All content on this website — including charts, analysis, price targets, support/resistance levels, and position zones — is generated entirely by AI and provided for educational and informational purposes only.
This is not financial advice. NEXUSNOIR VENTURES SL (the operator of this website) is not a registered investment adviser or broker-dealer. You should not make investment decisions based solely on this information. Always do your own research and consult a qualified financial advisor.
By continuing, you acknowledge that you have read and agree to our full disclaimer & terms of use and privacy policy.