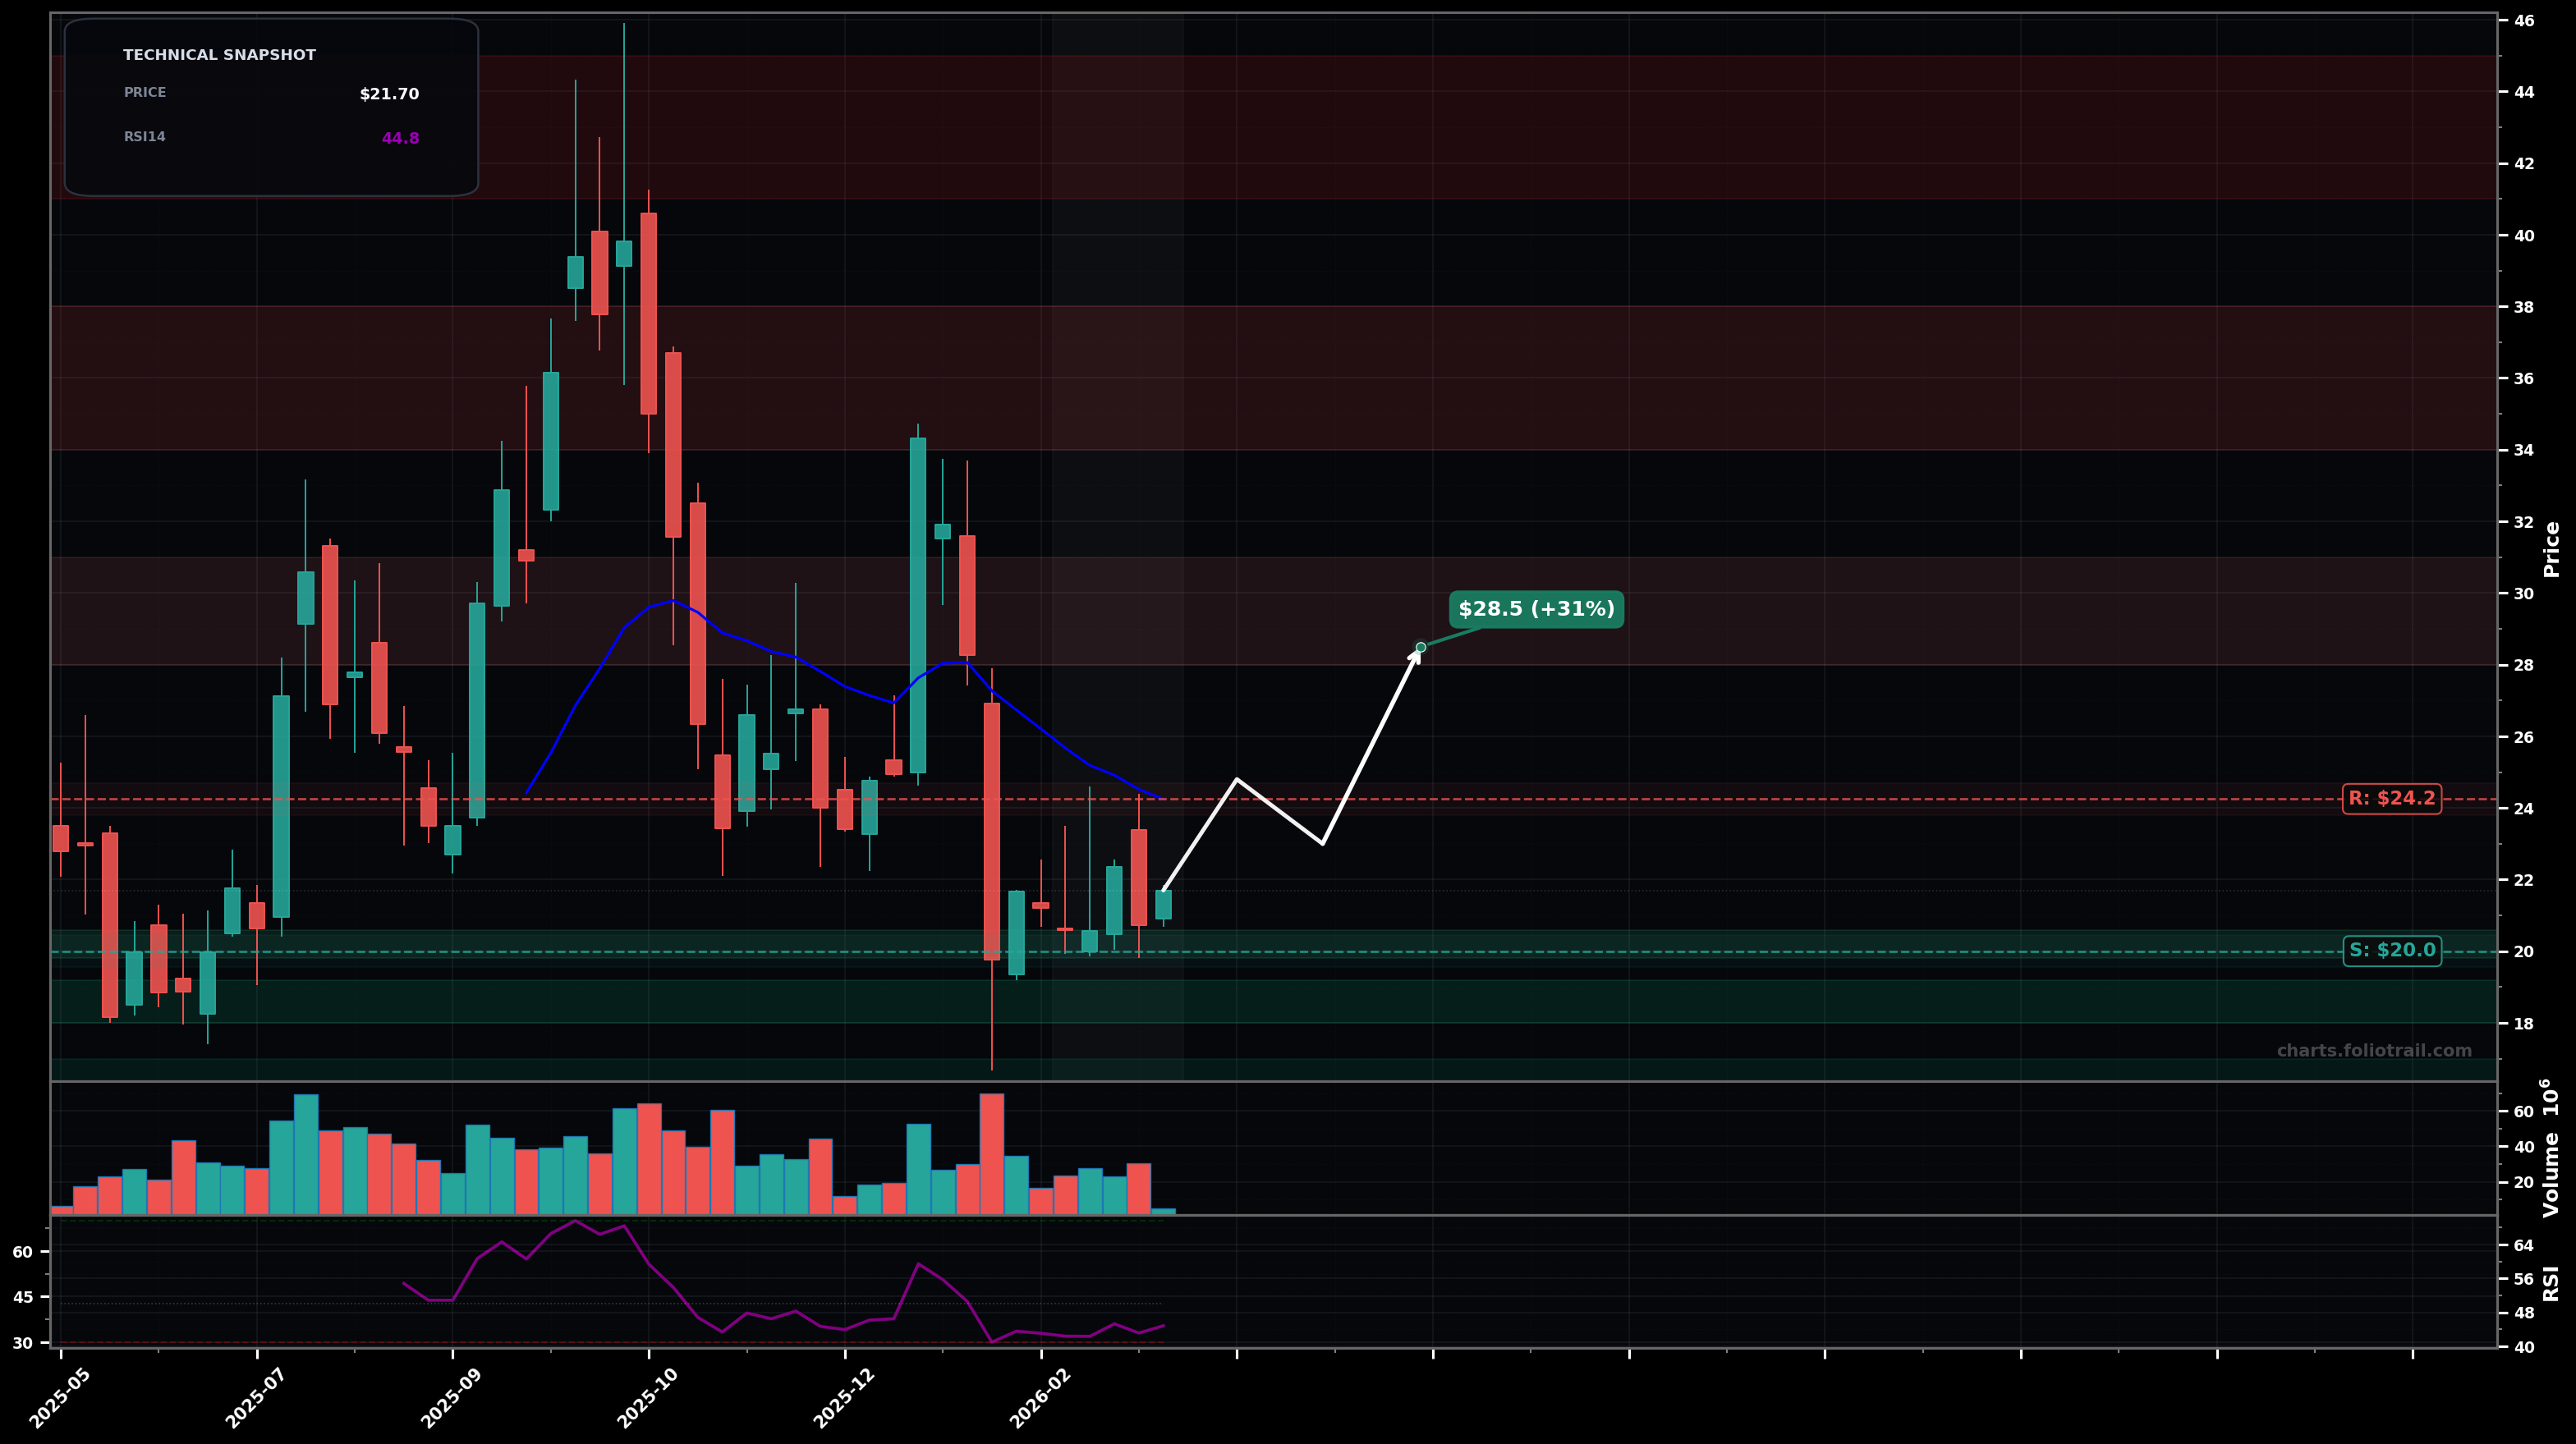
As of March 24, 2026, GLXY (Galaxy Digital Inc. Class A Common Stock) is in a bottoming attempt state on the weekly chart, with a confidence level of 62%. Key support is at $20.0 and key resistance at $24.2. Weekly candles are basing around $20–$22 after a sharp selloff; price ($21.70) is below the declining EMA20 (~$24.25) and momentum is weak (RSI ~44.8).
Base continues, then a breakout-reversal attempt: reclaim $24–$25 (EMA area) and grind toward the next supply zone; Elliott view: potential Wave (C) of an A-B-C correction completing and starting a new impulsive Wave 1, with first confirmation on reclaim of the EMA cluster; Fib: first upside reaction often stalls near the 38.2% retrace of the last major downswing (roughly mid-$20s). (~60%)
Support breaks and the downtrend resumes: loss of the ~$20 floor triggers another leg lower (capitulation risk), consistent with Elliott alternative where the recent base is only a Wave (4) pause before Wave (5) down; Fib: extension below the prior swing low becomes likely once $20 fails. (~40%)
Weekly close > $24.25 and then 2 weekly closes holding above $24.00
Weekly close < $19.00
Start near the established base/support (~$20), add on a clean liquidity sweep/retest of the prior swing low area, and heavy add only if a deeper capitulation leg prints then stabilizes (risk-managed because trend MAs are still overhead).
Trim into overhead supply from prior breakdown zones and likely Fib retracement/MA congestion (mid/high-$20s then $30s); fully close into prior major distribution area near the old highs (low/mid-$40s) where mean reversion risk is highest.
As of March 24, 2026, GLXY (Galaxy Digital Inc. Class A Common Stock) is in a bottoming attempt state on the weekly chart with 62% confidence. Weekly candles are basing around $20–$22 after a sharp selloff; price ($21.70) is below the declining EMA20 (~$24.25) and momentum is weak (RSI ~44.8).
On the weekly timeframe, GLXY has key support at $20.0 and key resistance at $24.2. The most likely scenario (bullish) targets $24.8 and $28.5, with a revert level at $23.0.
GLXY (Galaxy Digital Inc. Class A Common Stock) is currently classified as bottoming attempt on the weekly chart, with 62% confidence. Confirmation requires: Weekly close > $24.25 and then 2 weekly closes holding above $24.00 This would be invalidated by: Weekly close < $19.00
The most likely scenario (bullish) targets $24.8 and $28.5, with a revert level at $23.0. The alternative scenario (bearish) targets $18.0 and $15.5.
All content on this website — including charts, analysis, price targets, support/resistance levels, and position zones — is generated entirely by AI and provided for educational and informational purposes only.
This is not financial advice. NEXUSNOIR VENTURES SL (the operator of this website) is not a registered investment adviser or broker-dealer. You should not make investment decisions based solely on this information. Always do your own research and consult a qualified financial advisor.
By continuing, you acknowledge that you have read and agree to our full disclaimer & terms of use and privacy policy.