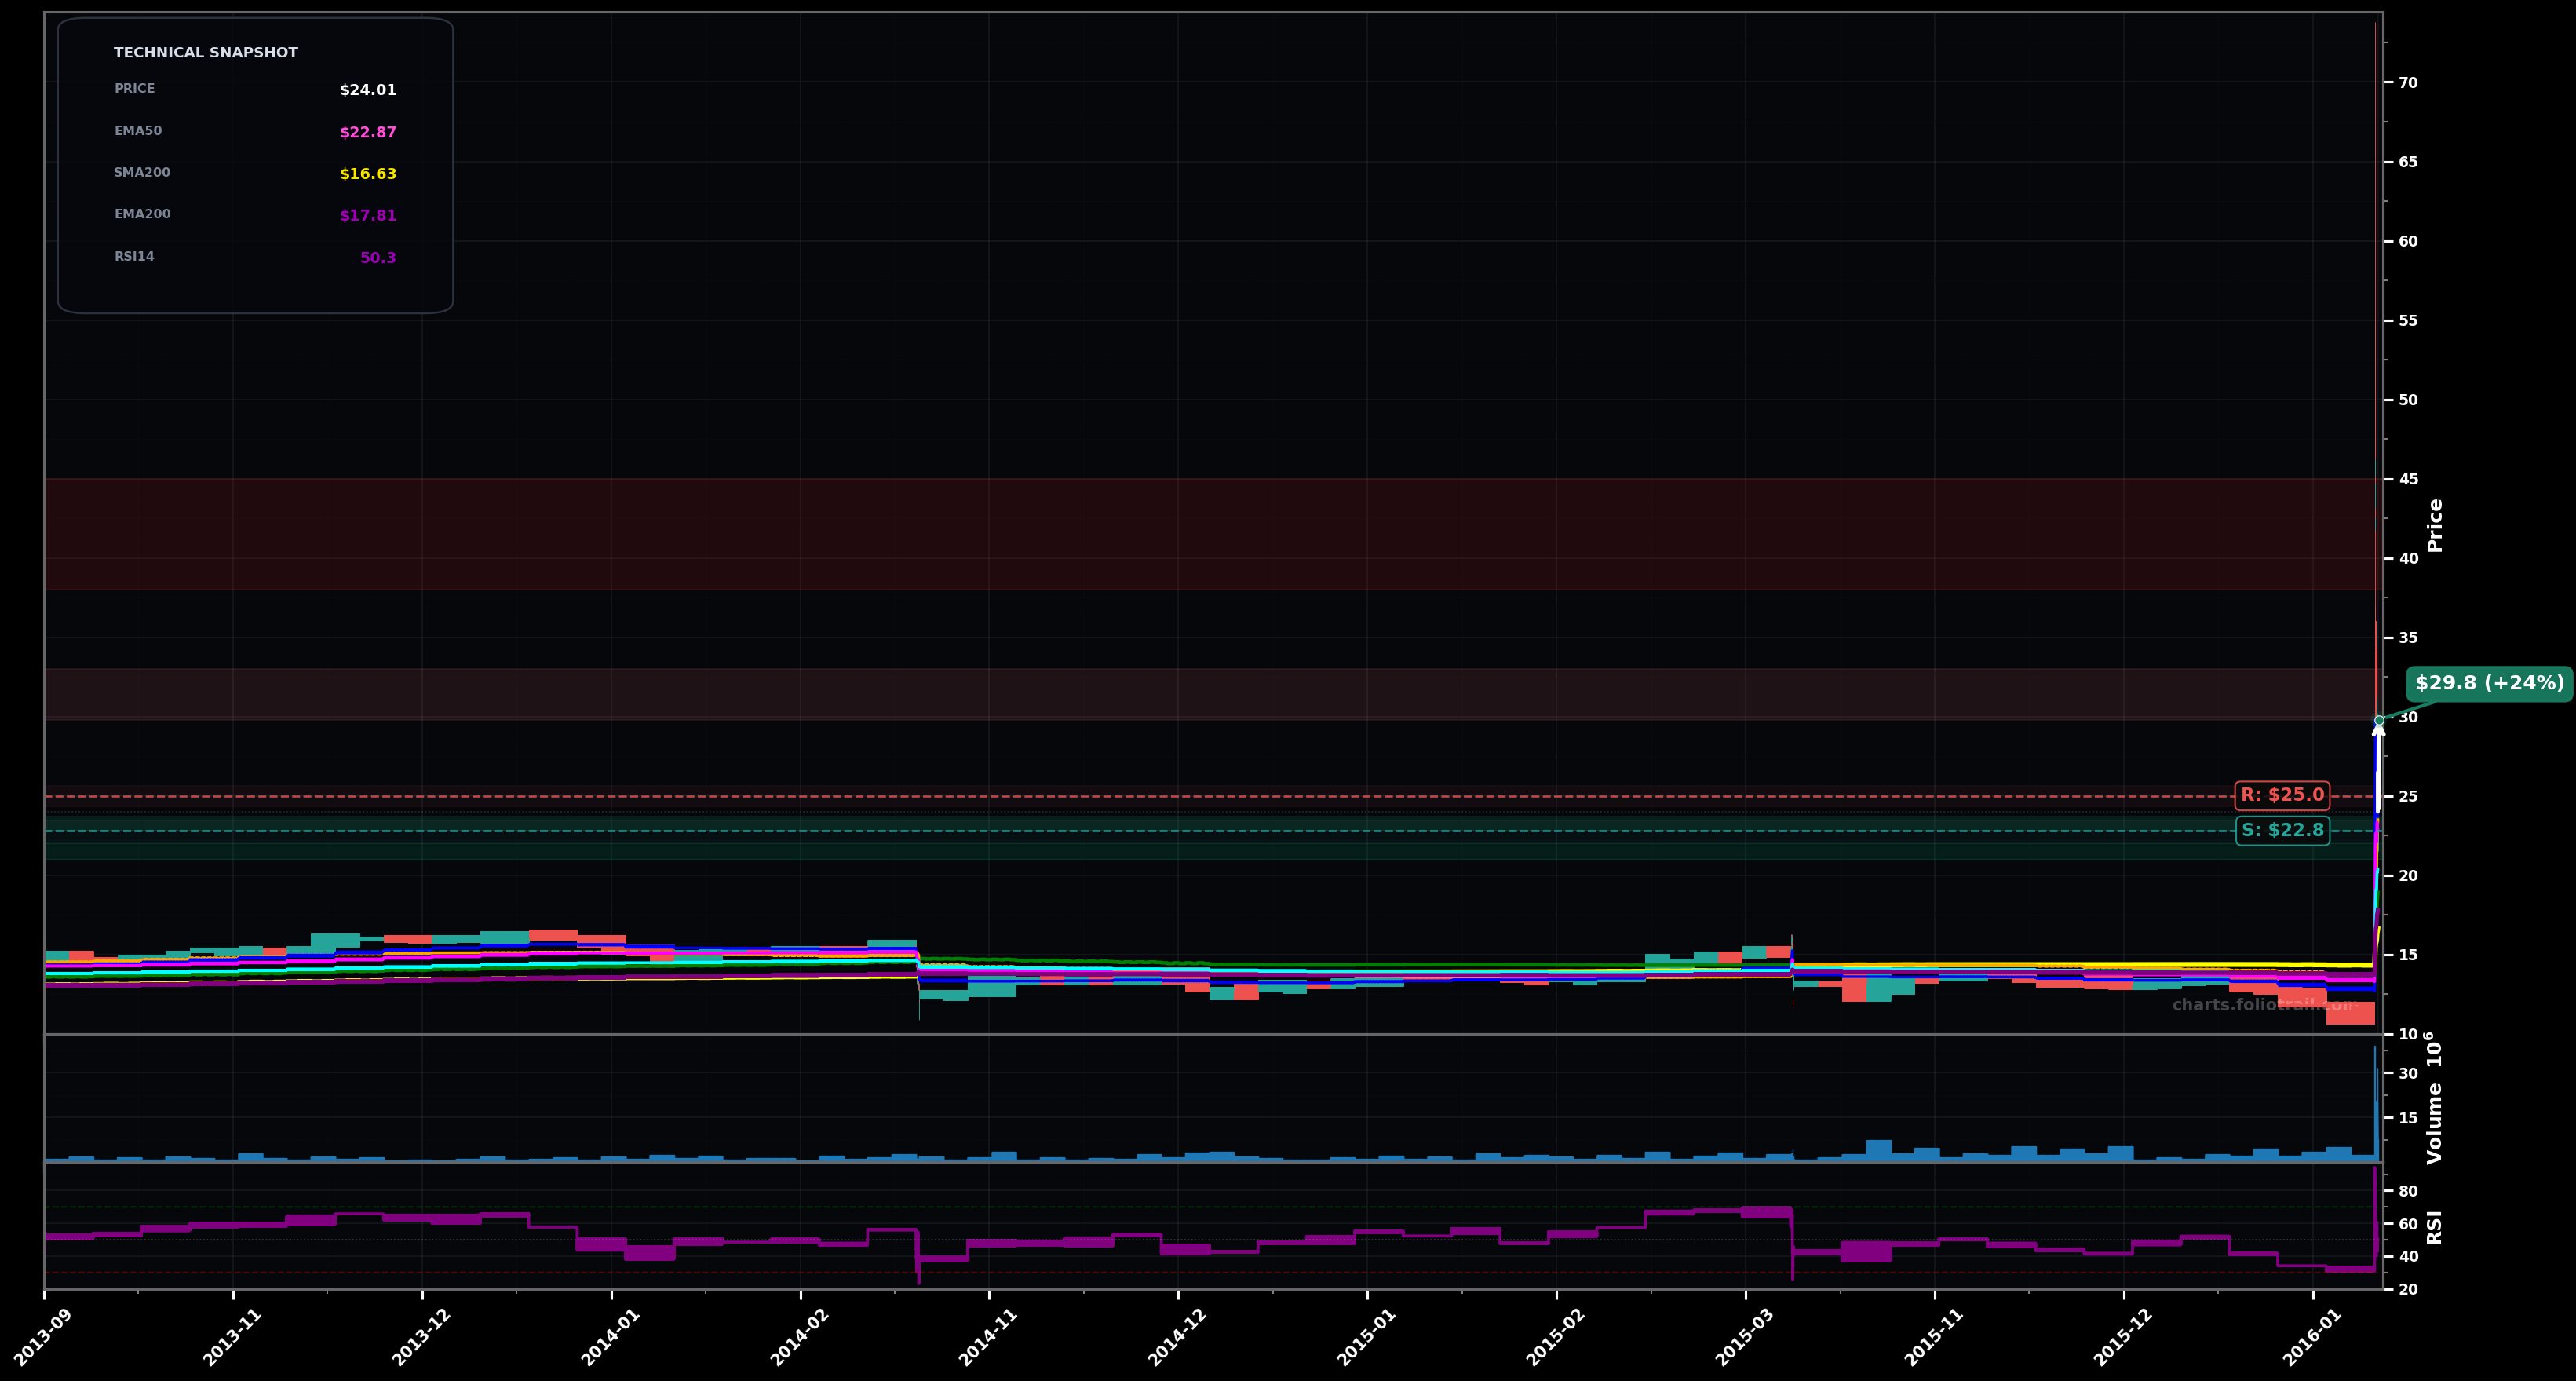
As of March 24, 2026, FLY (Firefly Aerospace Inc.) is in a choppy range state on the weekly chart, with a confidence level of 62%. Key support is at $22.8 and key resistance at $25.0. Weekly price is holding above the rising short/mid MAs (SMA50/EMA50/EMA100) but is still below the prior swing-high supply zone near the mid-$20s; momentum is neutral (RSI ~50).
Range resolution to the upside: hold above the EMA50 (pink ~$22.87) then break $25.00, opening a push toward the next fib/extension zone and prior overhead liquidity.
Bearish rejection: fail at $25.00 then lose the EMA50/nearby support, rotating down toward the EMA100 (cyan ~$20.38) and the broader long-term MA cluster.
2+ weekly closes above $25.00 (clear reclaim/hold above the recent supply zone) would confirm a transition toward BREAKOUT_REVERSAL.
A weekly close below $22.80 (loss of EMA50 pink area) would invalidate the neutral/range bias and shift toward a bearish breakdown setup.
Starter near EMA50/SMA50 support; add on breakdown-retest toward $21; heavy add near EMA100 ($20.38) / SMA100 ($18.92) confluence where a wave-2/4 type pullback often stabilizes.
Trim into likely wave-3/5 extension zones after a $25 breakout; progressively reduce as price stretches well above the MA stack (mean-reversion risk rises materially).
As of March 24, 2026, FLY (Firefly Aerospace Inc.) is in a choppy range state on the weekly chart with 62% confidence. Weekly price is holding above the rising short/mid MAs (SMA50/EMA50/EMA100) but is still below the prior swing-high supply zone near the mid-$20s; momentum is neutral (RSI ~50).
On the weekly timeframe, FLY has key support at $22.8 and key resistance at $25.0. The most likely scenario (bullish) targets $26.5 and $29.8, with a revert level at $24.2.
FLY (Firefly Aerospace Inc.) is currently classified as choppy range on the weekly chart, with 62% confidence. Confirmation requires: 2+ weekly closes above $25.00 (clear reclaim/hold above the recent supply zone) would confirm a transition toward BREAKOUT_REVERSAL. This would be invalidated by: A weekly close below $22.80 (loss of EMA50 pink area) would invalidate the neutral/range bias and shift toward a bearish breakdown setup.
The most likely scenario (bullish) targets $26.5 and $29.8, with a revert level at $24.2. The alternative scenario (bearish) targets $21.0 and $18.9.
All content on this website — including charts, analysis, price targets, support/resistance levels, and position zones — is generated entirely by AI and provided for educational and informational purposes only.
This is not financial advice. NEXUSNOIR VENTURES SL (the operator of this website) is not a registered investment adviser or broker-dealer. You should not make investment decisions based solely on this information. Always do your own research and consult a qualified financial advisor.
By continuing, you acknowledge that you have read and agree to our full disclaimer & terms of use and privacy policy.