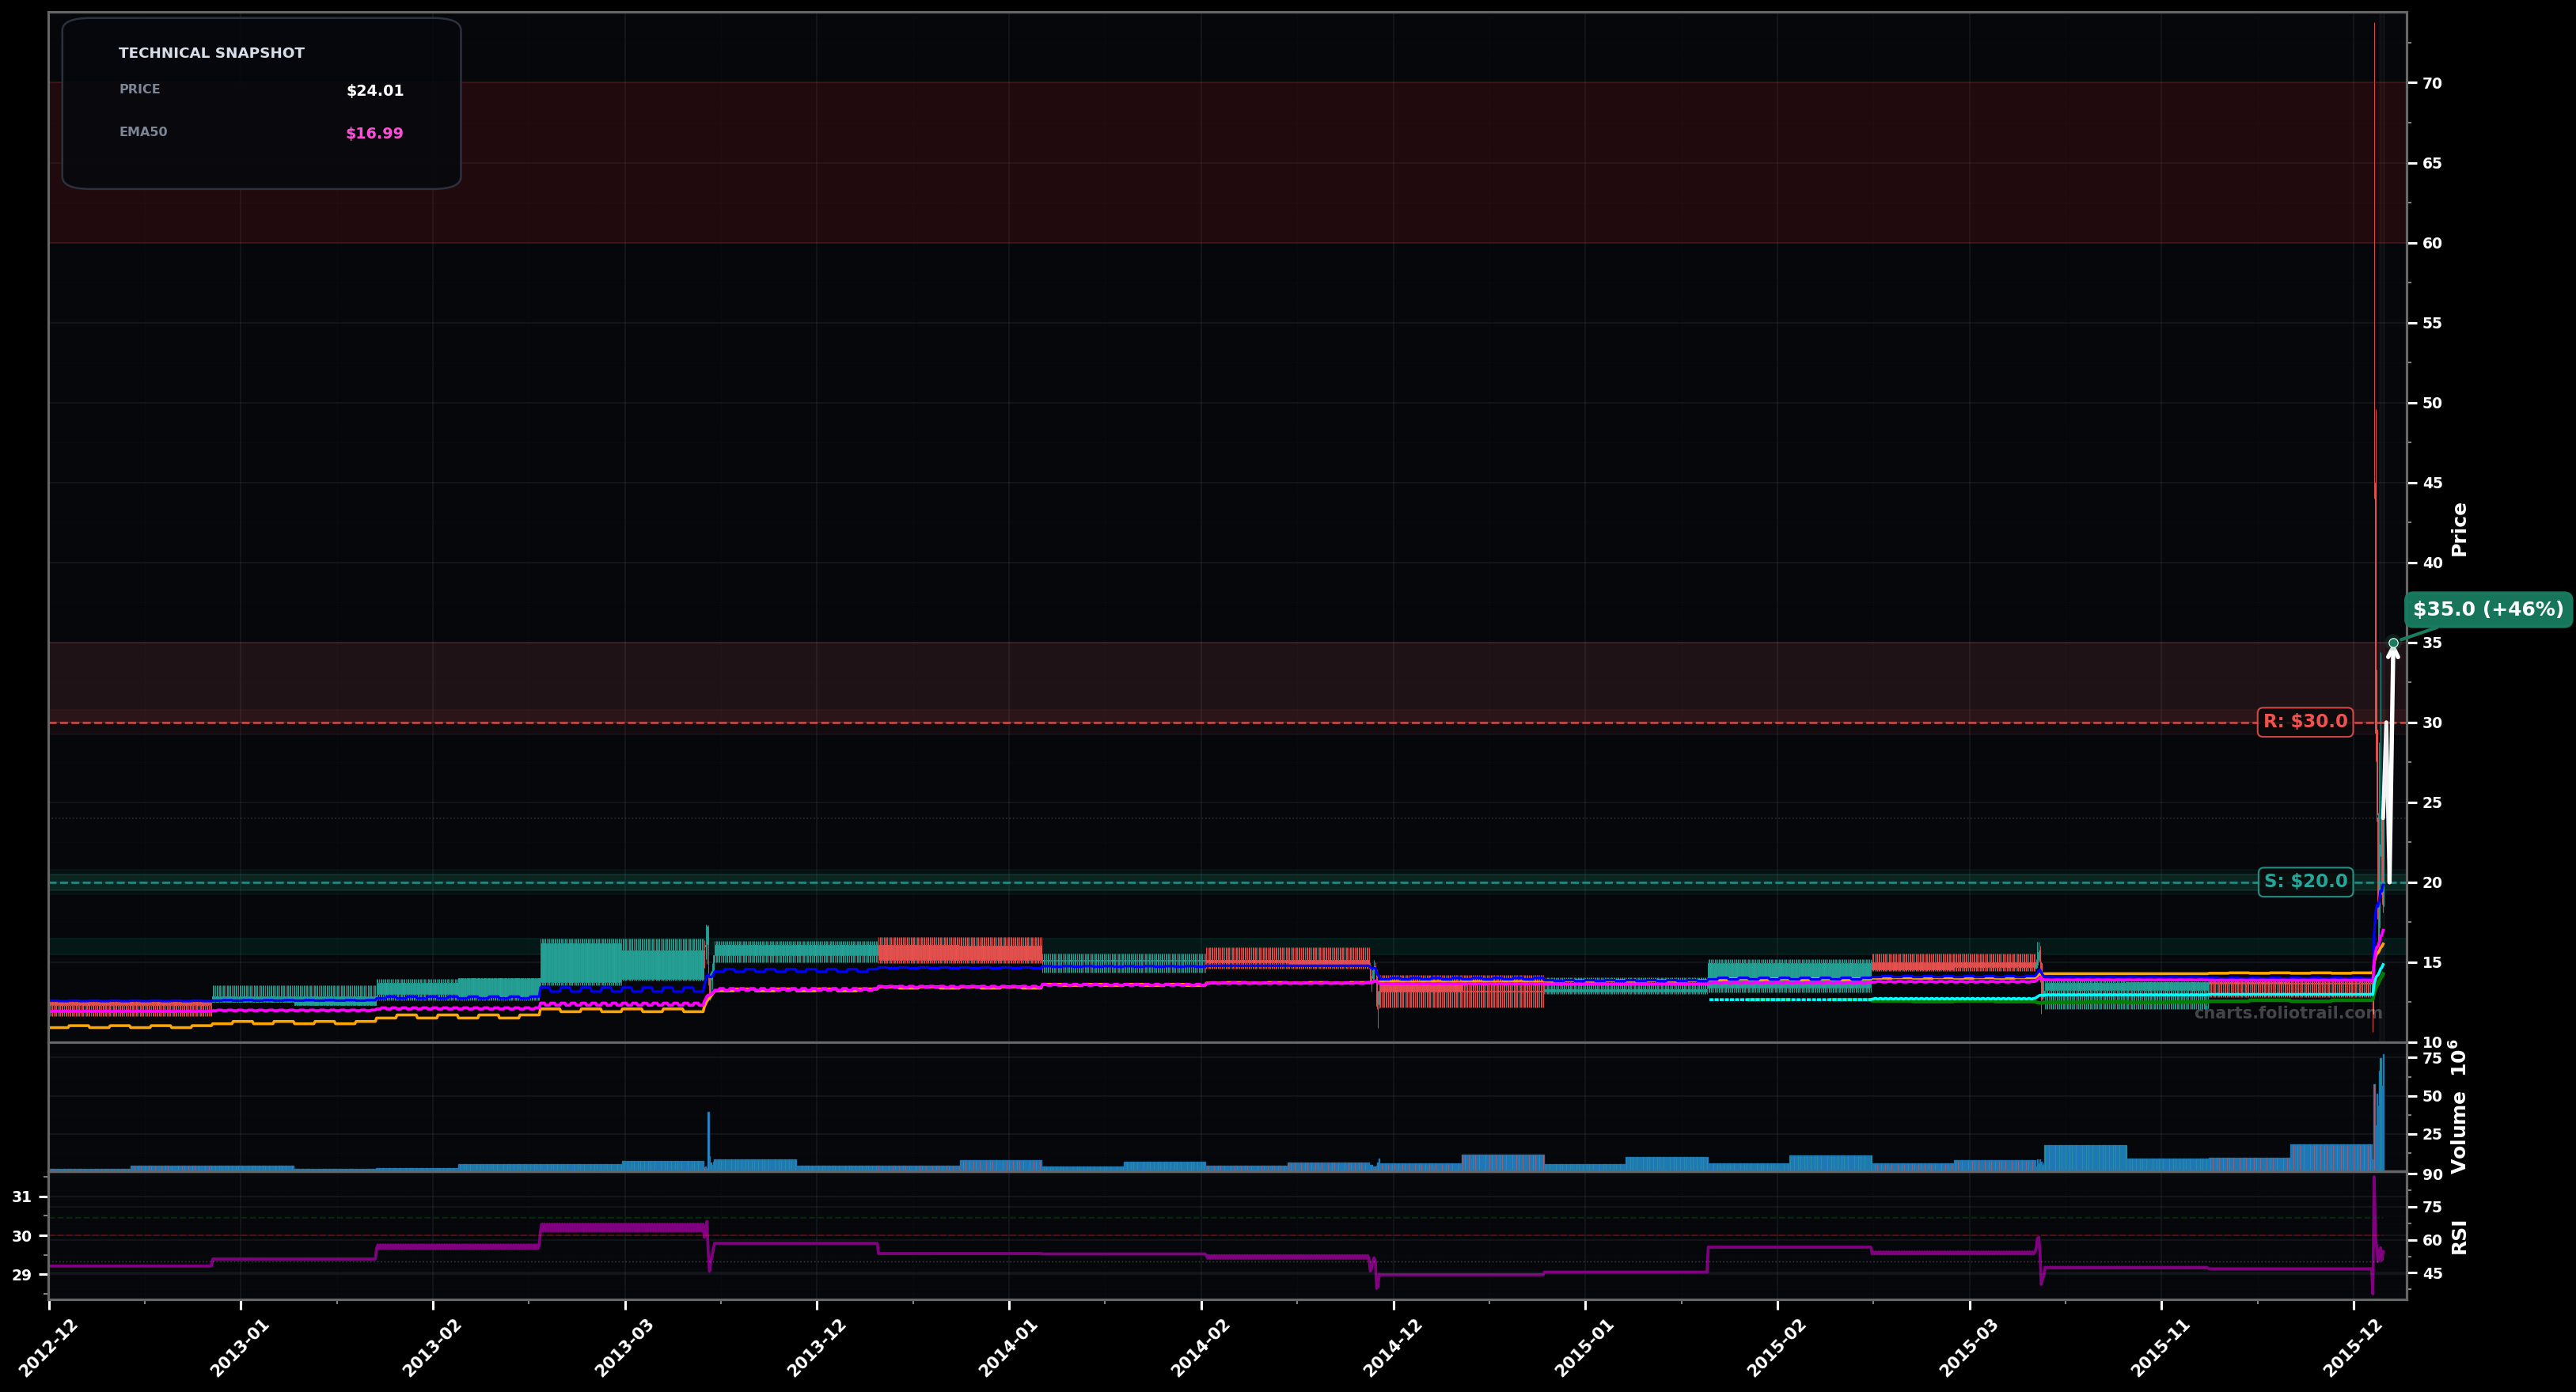
As of March 24, 2026, FLY (Firefly Aerospace Inc.) is in a volatility expansion state on the monthly chart, with a confidence level of 74%. Key support is at $20.0 and key resistance at $30.0. Monthly candle shows a sharp volatility expansion/vertical spike from a long flat base around $14–$16, closing near $24 after printing an extreme wick high; volume surged.
Mean-reversion pullback into the breakout zone, then attempt to rebuild and push back toward the first post-spike supply area; Elliott view: this spike likely acted like Wave (3) of an initial impulse, with a Wave (4) pullback next before a Wave (5) retest attempt.
Failed breakout: price loses the breakout area and drifts back into the prior multi-year base; Elliott view: spike becomes an ending/throw-over move with an ABC retrace toward the base; Fibonacci: common retrace is ~61.8% back into the move, aligning with mid/high-teens.
Hold (2+ monthly closes) above $20.00 while keeping higher lows on pullbacks
Monthly close back below $16.90 (EMA50) would signal failed breakout/return-to-base risk
Buy-the-retest plan: $20 is round-number breakout retest; $18 is deeper fib/structure pullback; $16 aligns with EMA50 vicinity/upper edge of the old base where invalidation risk is defined.
Trim into likely post-spike supply ($30–$35) and extension zones; reduce more aggressively on multi-sigma extensions ($40–$50); consider full exit if price revisits the extreme wick zone ($60–$70) where blow-off/long-term mean reversion risk is highest.
As of March 24, 2026, FLY (Firefly Aerospace Inc.) is in a volatility expansion state on the monthly chart with 74% confidence. Monthly candle shows a sharp volatility expansion/vertical spike from a long flat base around $14–$16, closing near $24 after printing an extreme wick high; volume surged.
On the monthly timeframe, FLY has key support at $20.0 and key resistance at $30.0. The most likely scenario (bullish) targets $30.0 and $35.0, with a revert level at $20.0.
FLY (Firefly Aerospace Inc.) is currently classified as volatility expansion on the monthly chart, with 74% confidence. Confirmation requires: Hold (2+ monthly closes) above $20.00 while keeping higher lows on pullbacks This would be invalidated by: Monthly close back below $16.90 (EMA50) would signal failed breakout/return-to-base risk
The most likely scenario (bullish) targets $30.0 and $35.0, with a revert level at $20.0. The alternative scenario (bearish) targets $18.0 and $15.0.
All content on this website — including charts, analysis, price targets, support/resistance levels, and position zones — is generated entirely by AI and provided for educational and informational purposes only.
This is not financial advice. NEXUSNOIR VENTURES SL (the operator of this website) is not a registered investment adviser or broker-dealer. You should not make investment decisions based solely on this information. Always do your own research and consult a qualified financial advisor.
By continuing, you acknowledge that you have read and agree to our full disclaimer & terms of use and privacy policy.