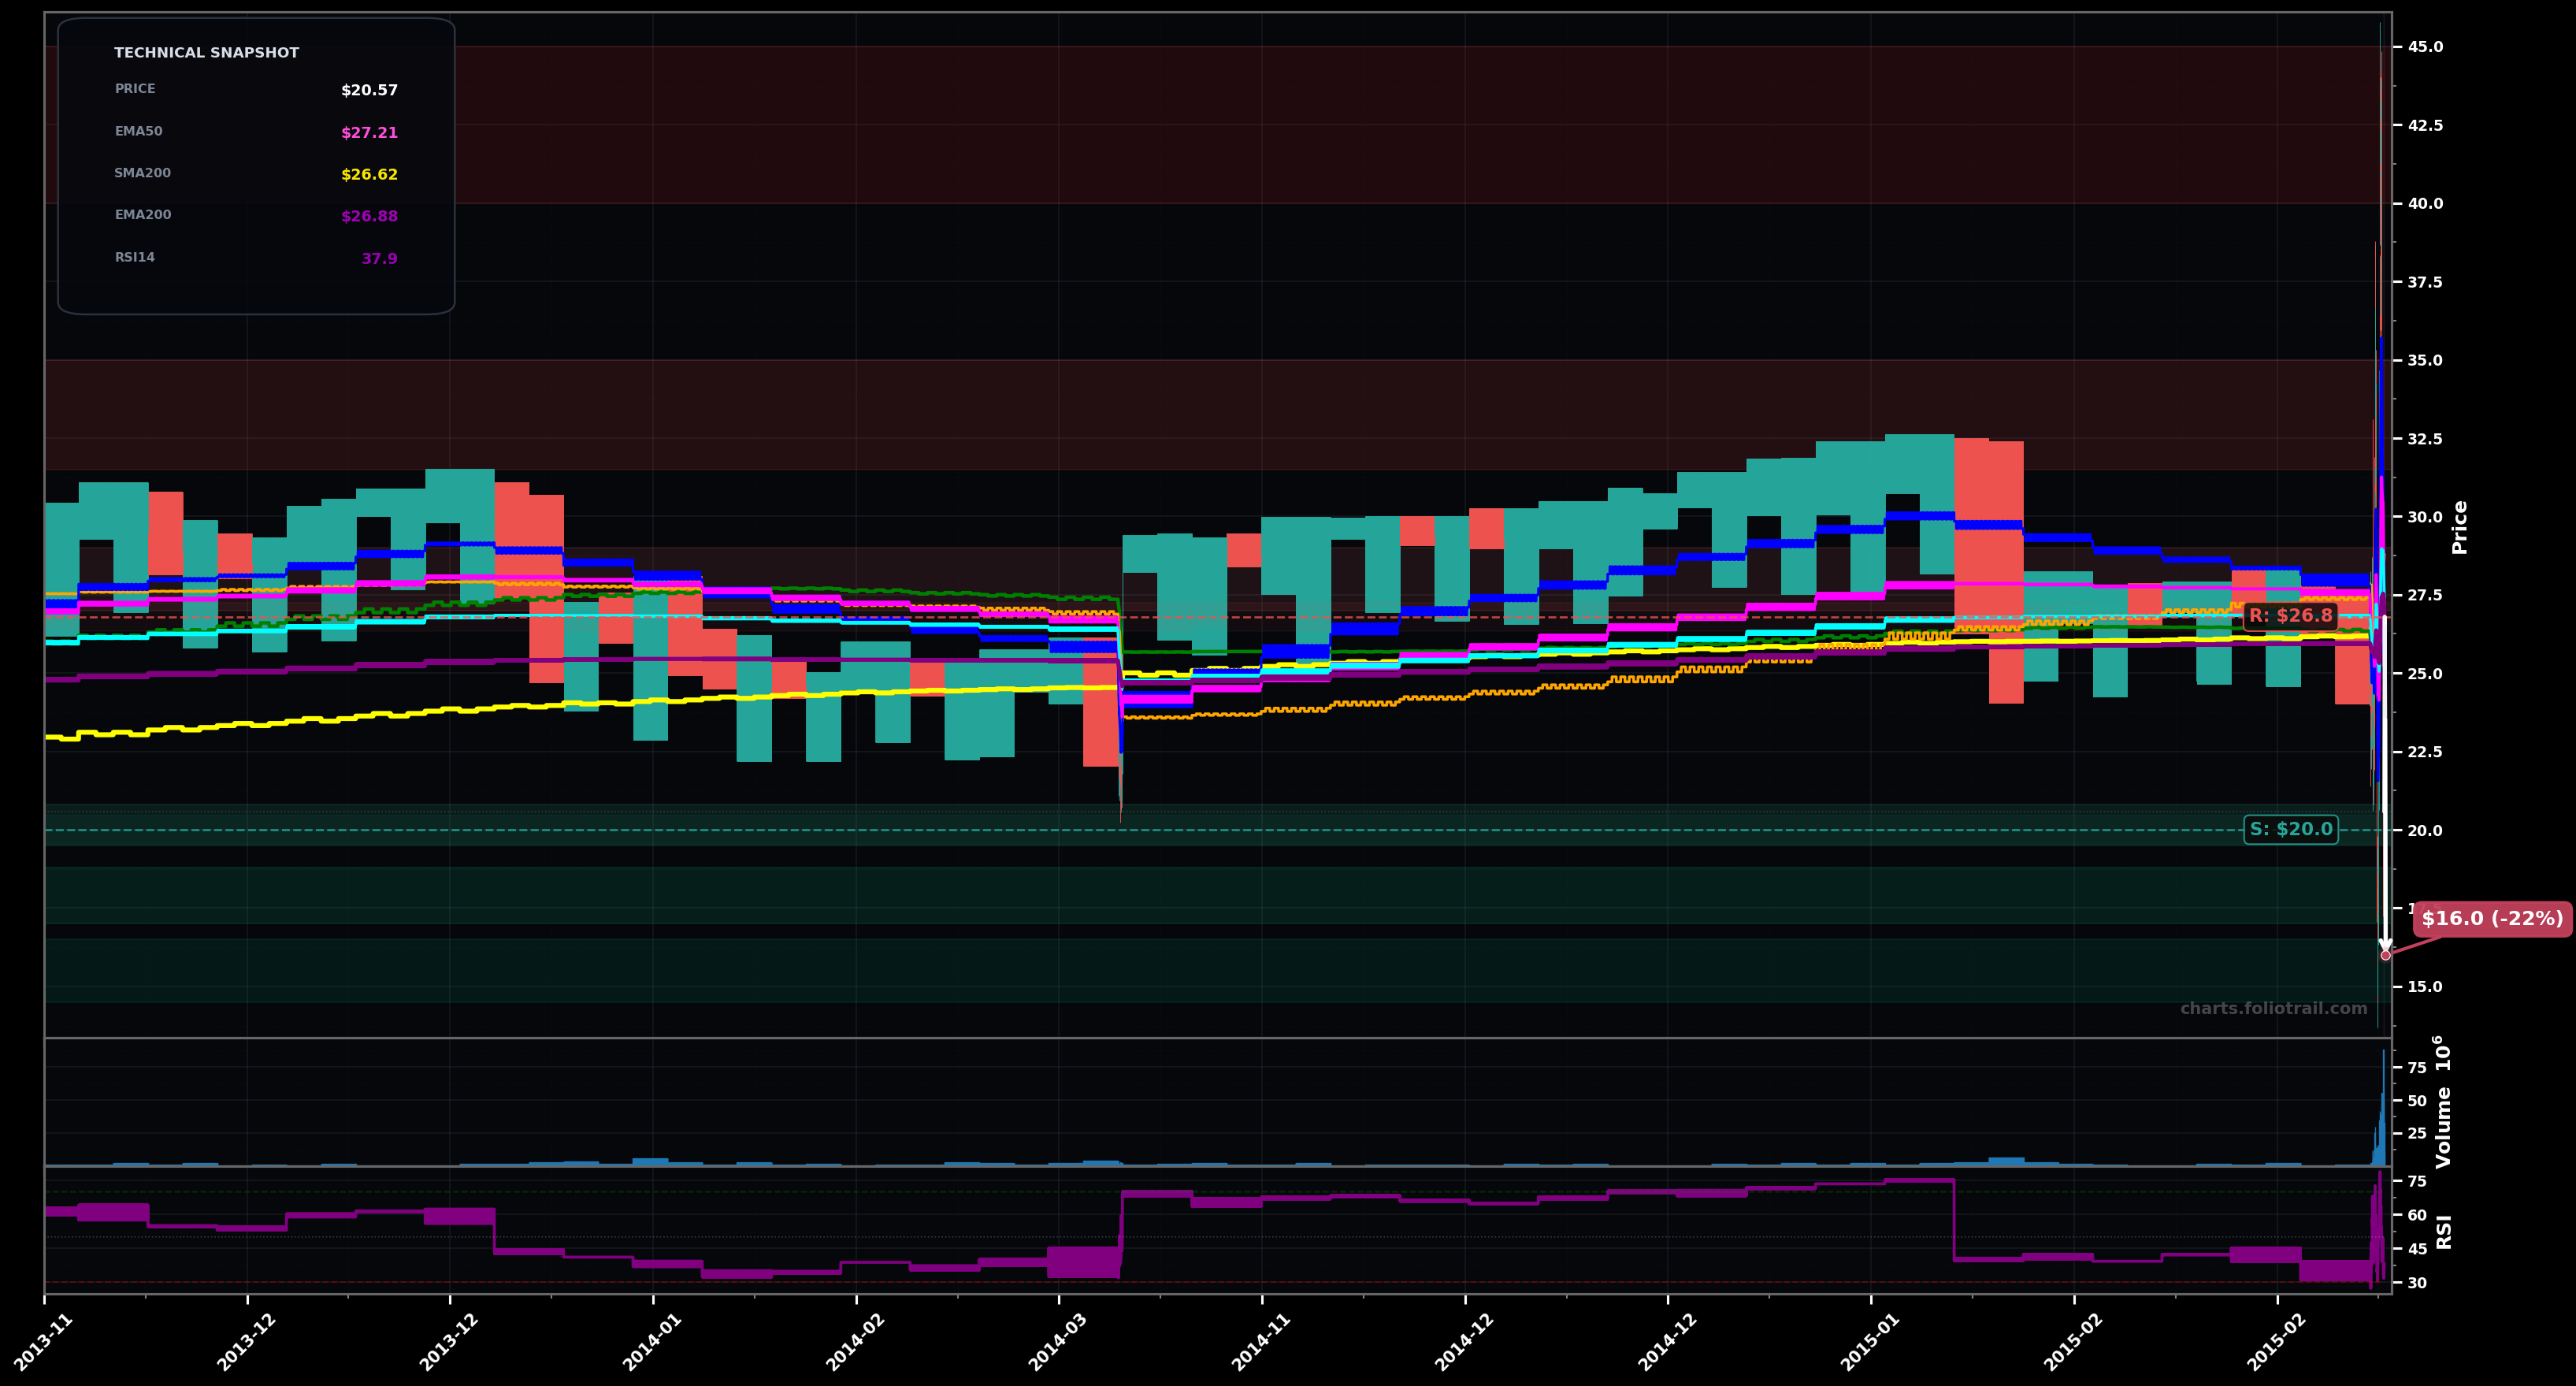
As of March 26, 2026, ETH (Grayscale Ethereum Mini Trust ETF) is in a falling knife state on the weekly chart, with a confidence level of 73%. Key support is at $20.0 and key resistance at $26.8. Sharp selloff to ~$20.57 with volatility spike; price now far below clustered MAs (~$26.6–$28.8) and RSI(14) ~38.
Dead-cat bounce / mean-reversion into the MA cluster (EMA200/SMA200 area), then rejection and another leg down (Elliott: impulsive drop likely in wave 3 or 5; bounce = wave 4).
Capitulation low forms near ~$20 then a base; reclaim of EMA200/SMA200 zone turns into breakout-reversal and squeezes toward prior range top (Elliott: drop completes wave 5; new cycle wave 1/2 starts).
Weekly close below $19.50
2 consecutive weekly closes back above $27.50
Scale in at current swing-low support (~$20), add on Fibonacci-style extension/capitulation zones if $20 fails, heavy add only if panic wick/weekly stabilization appears below prior support.
Trim into MA-cluster resistance first (~$27–$29), then into next fib/previous supply (~$31.5–$35); fully exit if an overextended vertical rebound reaches the prior spike supply zone (~$40–$45).
As of March 26, 2026, ETH (Grayscale Ethereum Mini Trust ETF) is in a falling knife state on the weekly chart with 73% confidence. Sharp selloff to ~$20.57 with volatility spike; price now far below clustered MAs (~$26.6–$28.8) and RSI(14) ~38.
On the weekly timeframe, ETH has key support at $20.0 and key resistance at $26.8. The most likely scenario (bearish) targets $26.8 and $16.0, with a revert level at $23.5.
ETH (Grayscale Ethereum Mini Trust ETF) is currently classified as falling knife on the weekly chart, with 73% confidence. Confirmation requires: Weekly close below $19.50 This would be invalidated by: 2 consecutive weekly closes back above $27.50
The most likely scenario (bearish) targets $26.8 and $16.0, with a revert level at $23.5. The alternative scenario (bullish) targets $27.5 and $32.5.
Multi-layer AI agents analyse 200+ stocks across daily, weekly, and monthly timeframes — producing market state classifications, price scenarios with targets, and position entry/exit levels. Updated every trading day after market close. No paywall. No sign-up required.
Built by Foliotrail.
All content on this website — including charts, analysis, price targets, support/resistance levels, and position zones — is generated entirely by AI and provided for educational and informational purposes only.
This is not financial advice. NEXUSNOIR VENTURES SL (the operator of this website) is not a registered investment adviser or broker-dealer. You should not make investment decisions based solely on this information. Always do your own research and consult a qualified financial advisor.
By continuing, you acknowledge that you have read and agree to our full disclaimer & terms of use and privacy policy.