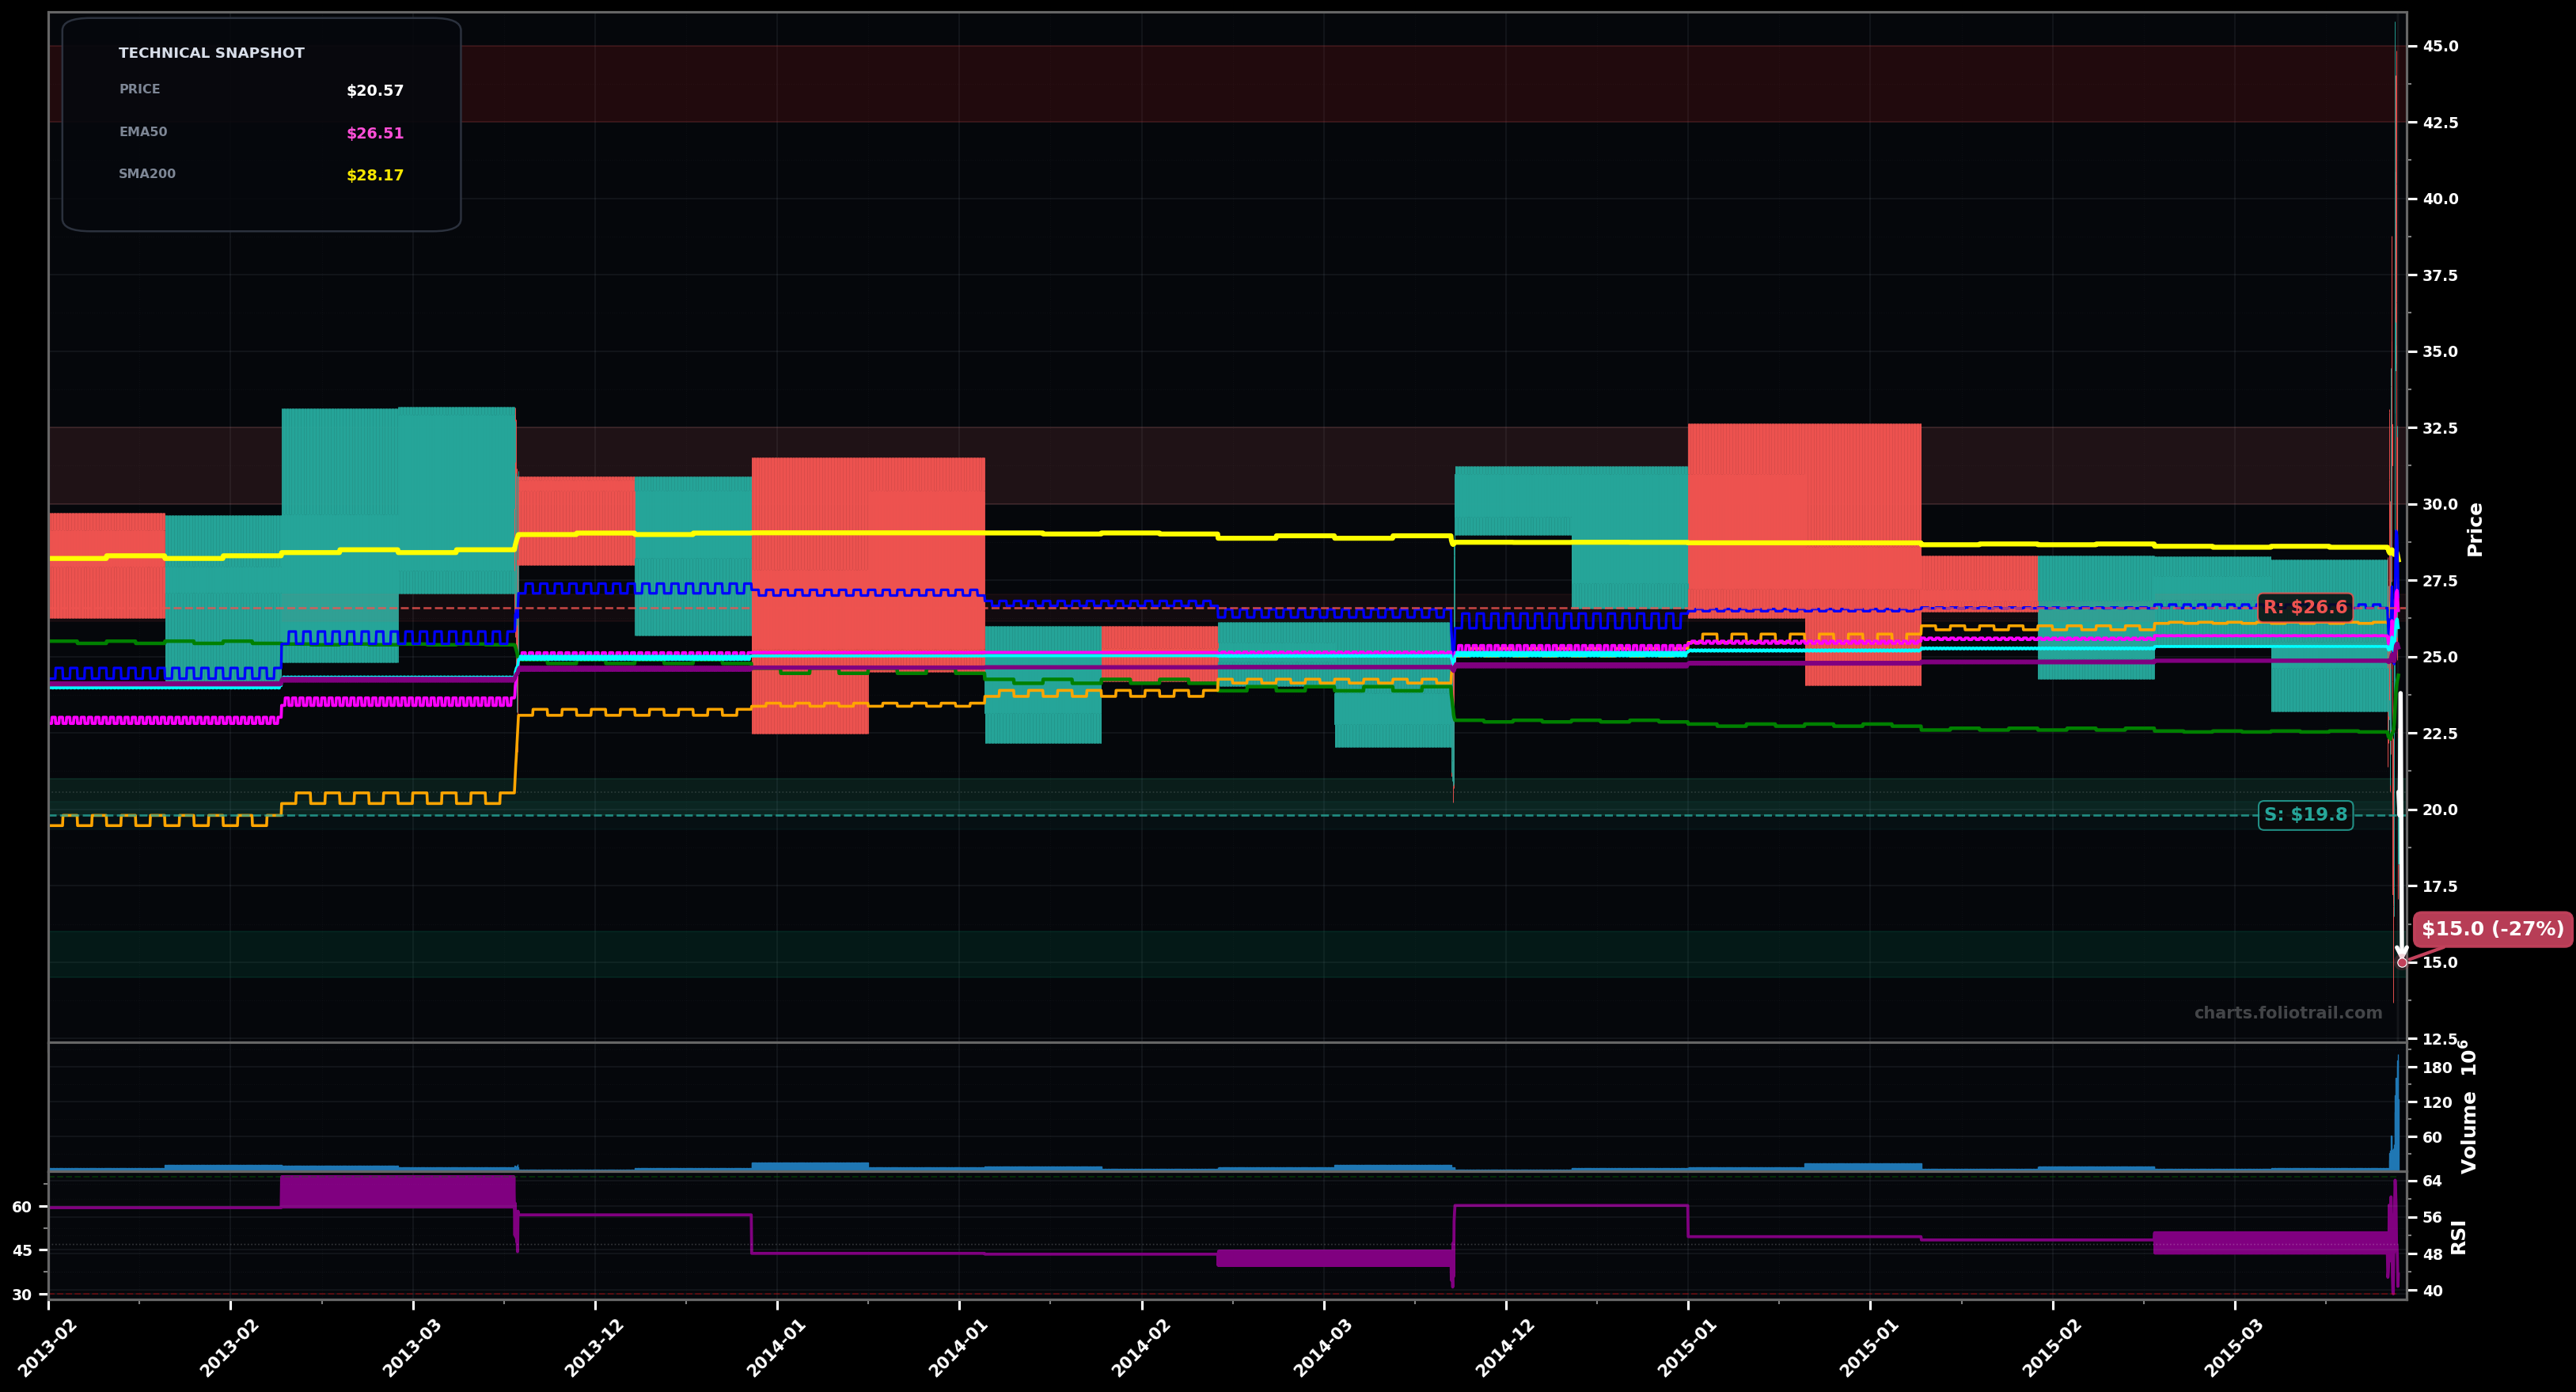
As of March 26, 2026, ETH (Grayscale Ethereum Mini Trust ETF) is in a downtrend state on the monthly chart, with a confidence level of 72%. Key support is at $19.8 and key resistance at $26.6. Monthly close/price at ~$20.57 sits well below all key MAs (EMA50/100/200 and SMA50/100/200), implying long-term bearish control with weak momentum (RSI ~43).
Bearish continuation: price rejects the MA cluster near the mid-$20s and grinds back to/through the recent swing-low; if $19.80 breaks on a monthly close, downside extends toward the mid-teens (Fib extension / prior demand). Prob ~60%.
Bottoming attempt: hold $19.80, form a higher low, then reclaim the MA cluster; this would resemble an Elliott Wave corrective end (ABC finishing) and pivot into a new impulsive leg if $26.60 is reclaimed. Prob ~40%.
Monthly close below $19.80 (breaks the most recent swing-low zone and keeps price under the MA cluster).
2 consecutive monthly closes above $26.60 (reclaim EMA50/SMA50 area with follow-through).
Scale-in around the swing-low support ($19.80) with deeper adds at likely Fib/psych levels ($17-$16-$15) if the downtrend extends; invalidate if reclaim >$26.60 shifts regime.
Trim into overhead multi-year MA/structure supply (high-$20s to $30s first), then progressively derisk into prior major resistance bands ($37-$45) where upside becomes increasingly stretched.
As of March 26, 2026, ETH (Grayscale Ethereum Mini Trust ETF) is in a downtrend state on the monthly chart with 72% confidence. Monthly close/price at ~$20.57 sits well below all key MAs (EMA50/100/200 and SMA50/100/200), implying long-term bearish control with weak momentum (RSI ~43).
On the monthly timeframe, ETH has key support at $19.8 and key resistance at $26.6. The most likely scenario (bearish) targets $19.8 and $15.0, with a revert level at $23.8.
ETH (Grayscale Ethereum Mini Trust ETF) is currently classified as downtrend on the monthly chart, with 72% confidence. Confirmation requires: Monthly close below $19.80 (breaks the most recent swing-low zone and keeps price under the MA cluster). This would be invalidated by: 2 consecutive monthly closes above $26.60 (reclaim EMA50/SMA50 area with follow-through).
The most likely scenario (bearish) targets $19.8 and $15.0, with a revert level at $23.8. The alternative scenario (bullish) targets $26.6 and $30.0.
Multi-layer AI agents analyse 200+ stocks across daily, weekly, and monthly timeframes — producing market state classifications, price scenarios with targets, and position entry/exit levels. Updated every trading day after market close. No paywall. No sign-up required.
Built by Foliotrail.
All content on this website — including charts, analysis, price targets, support/resistance levels, and position zones — is generated entirely by AI and provided for educational and informational purposes only.
This is not financial advice. NEXUSNOIR VENTURES SL (the operator of this website) is not a registered investment adviser or broker-dealer. You should not make investment decisions based solely on this information. Always do your own research and consult a qualified financial advisor.
By continuing, you acknowledge that you have read and agree to our full disclaimer & terms of use and privacy policy.