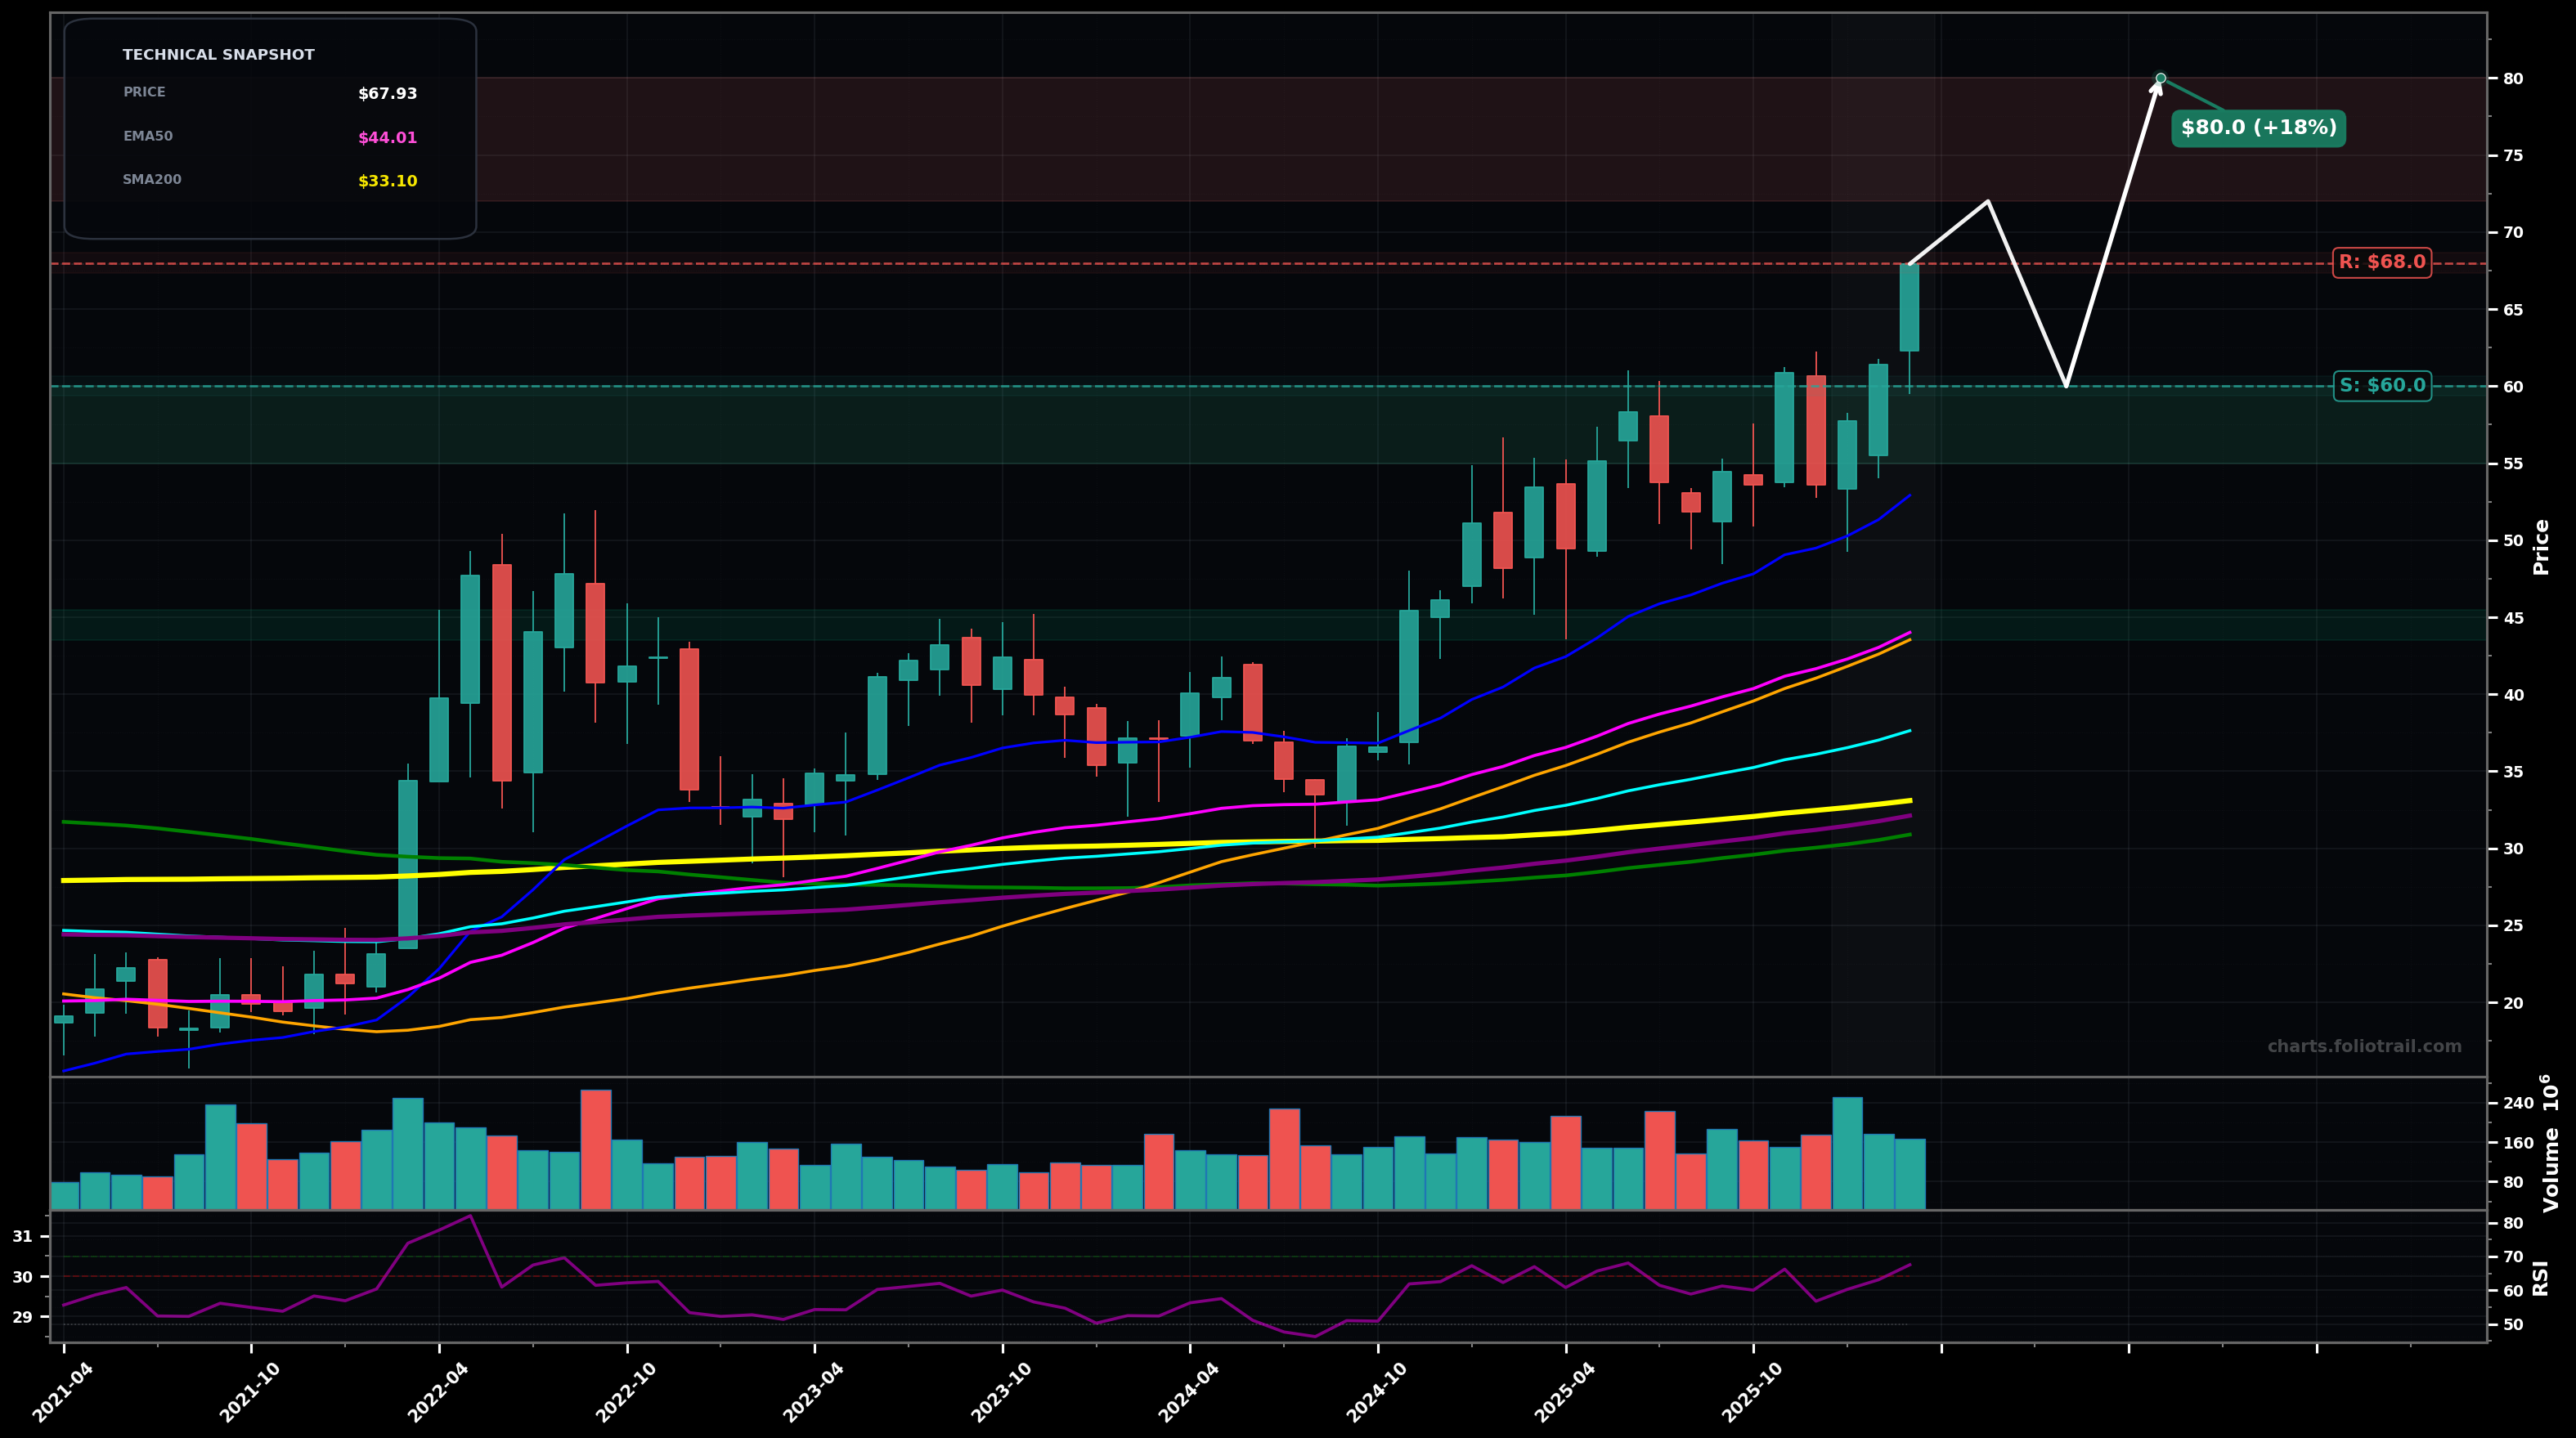
As of March 26, 2026, EQT (EQT Corporation) is in a parabolic state on the monthly chart, with a confidence level of 72%. Key support is at $60.0 and key resistance at $68.0. Strong monthly continuation to new swing highs; price is extended well above rising EMA50/EMA100 with momentum (RSI ~67).
Bullish continuation: brief consolidation/pullback that holds the prior breakout area, then a push to a new high (late Wave 5 extension risk remains).
Deeper Wave 4-style correction: mean reversion toward fast MAs after the vertical run; volatility rises and the trend pauses before any renewed advance.
Hold above $60.00 on the next monthly close (no deeper pullback than that).
Monthly close below $52.90 (EMA20) would break the steep advance and shift to corrective/basing risk.
Buy-the-dip zones align with prior breakout/round-number support (~$60), EMA20 (~$52.9), and EMA50 (~$44) as likely Wave 4 retracement areas (typical Fib 23.6–38.2% of the $30→$68 impulse).
Trim into upside extensions where price is increasingly stretched vs EMA50/EMA100 (late impulse/Wave 5 risk); use $72–$80 as first extension zone, then scale heavier if price runs into $80+ and becomes climactic.
As of March 26, 2026, EQT (EQT Corporation) is in a parabolic state on the monthly chart with 72% confidence. Strong monthly continuation to new swing highs; price is extended well above rising EMA50/EMA100 with momentum (RSI ~67).
On the monthly timeframe, EQT has key support at $60.0 and key resistance at $68.0. The most likely scenario (bullish) targets $72.0 and $80.0, with a revert level at $60.0.
EQT (EQT Corporation) is currently classified as parabolic on the monthly chart, with 72% confidence. Confirmation requires: Hold above $60.00 on the next monthly close (no deeper pullback than that). This would be invalidated by: Monthly close below $52.90 (EMA20) would break the steep advance and shift to corrective/basing risk.
The most likely scenario (bullish) targets $72.0 and $80.0, with a revert level at $60.0. The alternative scenario (bearish) targets $52.9 and $44.0.
Multi-layer AI agents analyse 200+ stocks across daily, weekly, and monthly timeframes — producing market state classifications, price scenarios with targets, and position entry/exit levels. Updated every trading day after market close. No paywall. No sign-up required.
Built by Foliotrail.
All content on this website — including charts, analysis, price targets, support/resistance levels, and position zones — is generated entirely by AI and provided for educational and informational purposes only.
This is not financial advice. NEXUSNOIR VENTURES SL (the operator of this website) is not a registered investment adviser or broker-dealer. You should not make investment decisions based solely on this information. Always do your own research and consult a qualified financial advisor.
By continuing, you acknowledge that you have read and agree to our full disclaimer & terms of use and privacy policy.