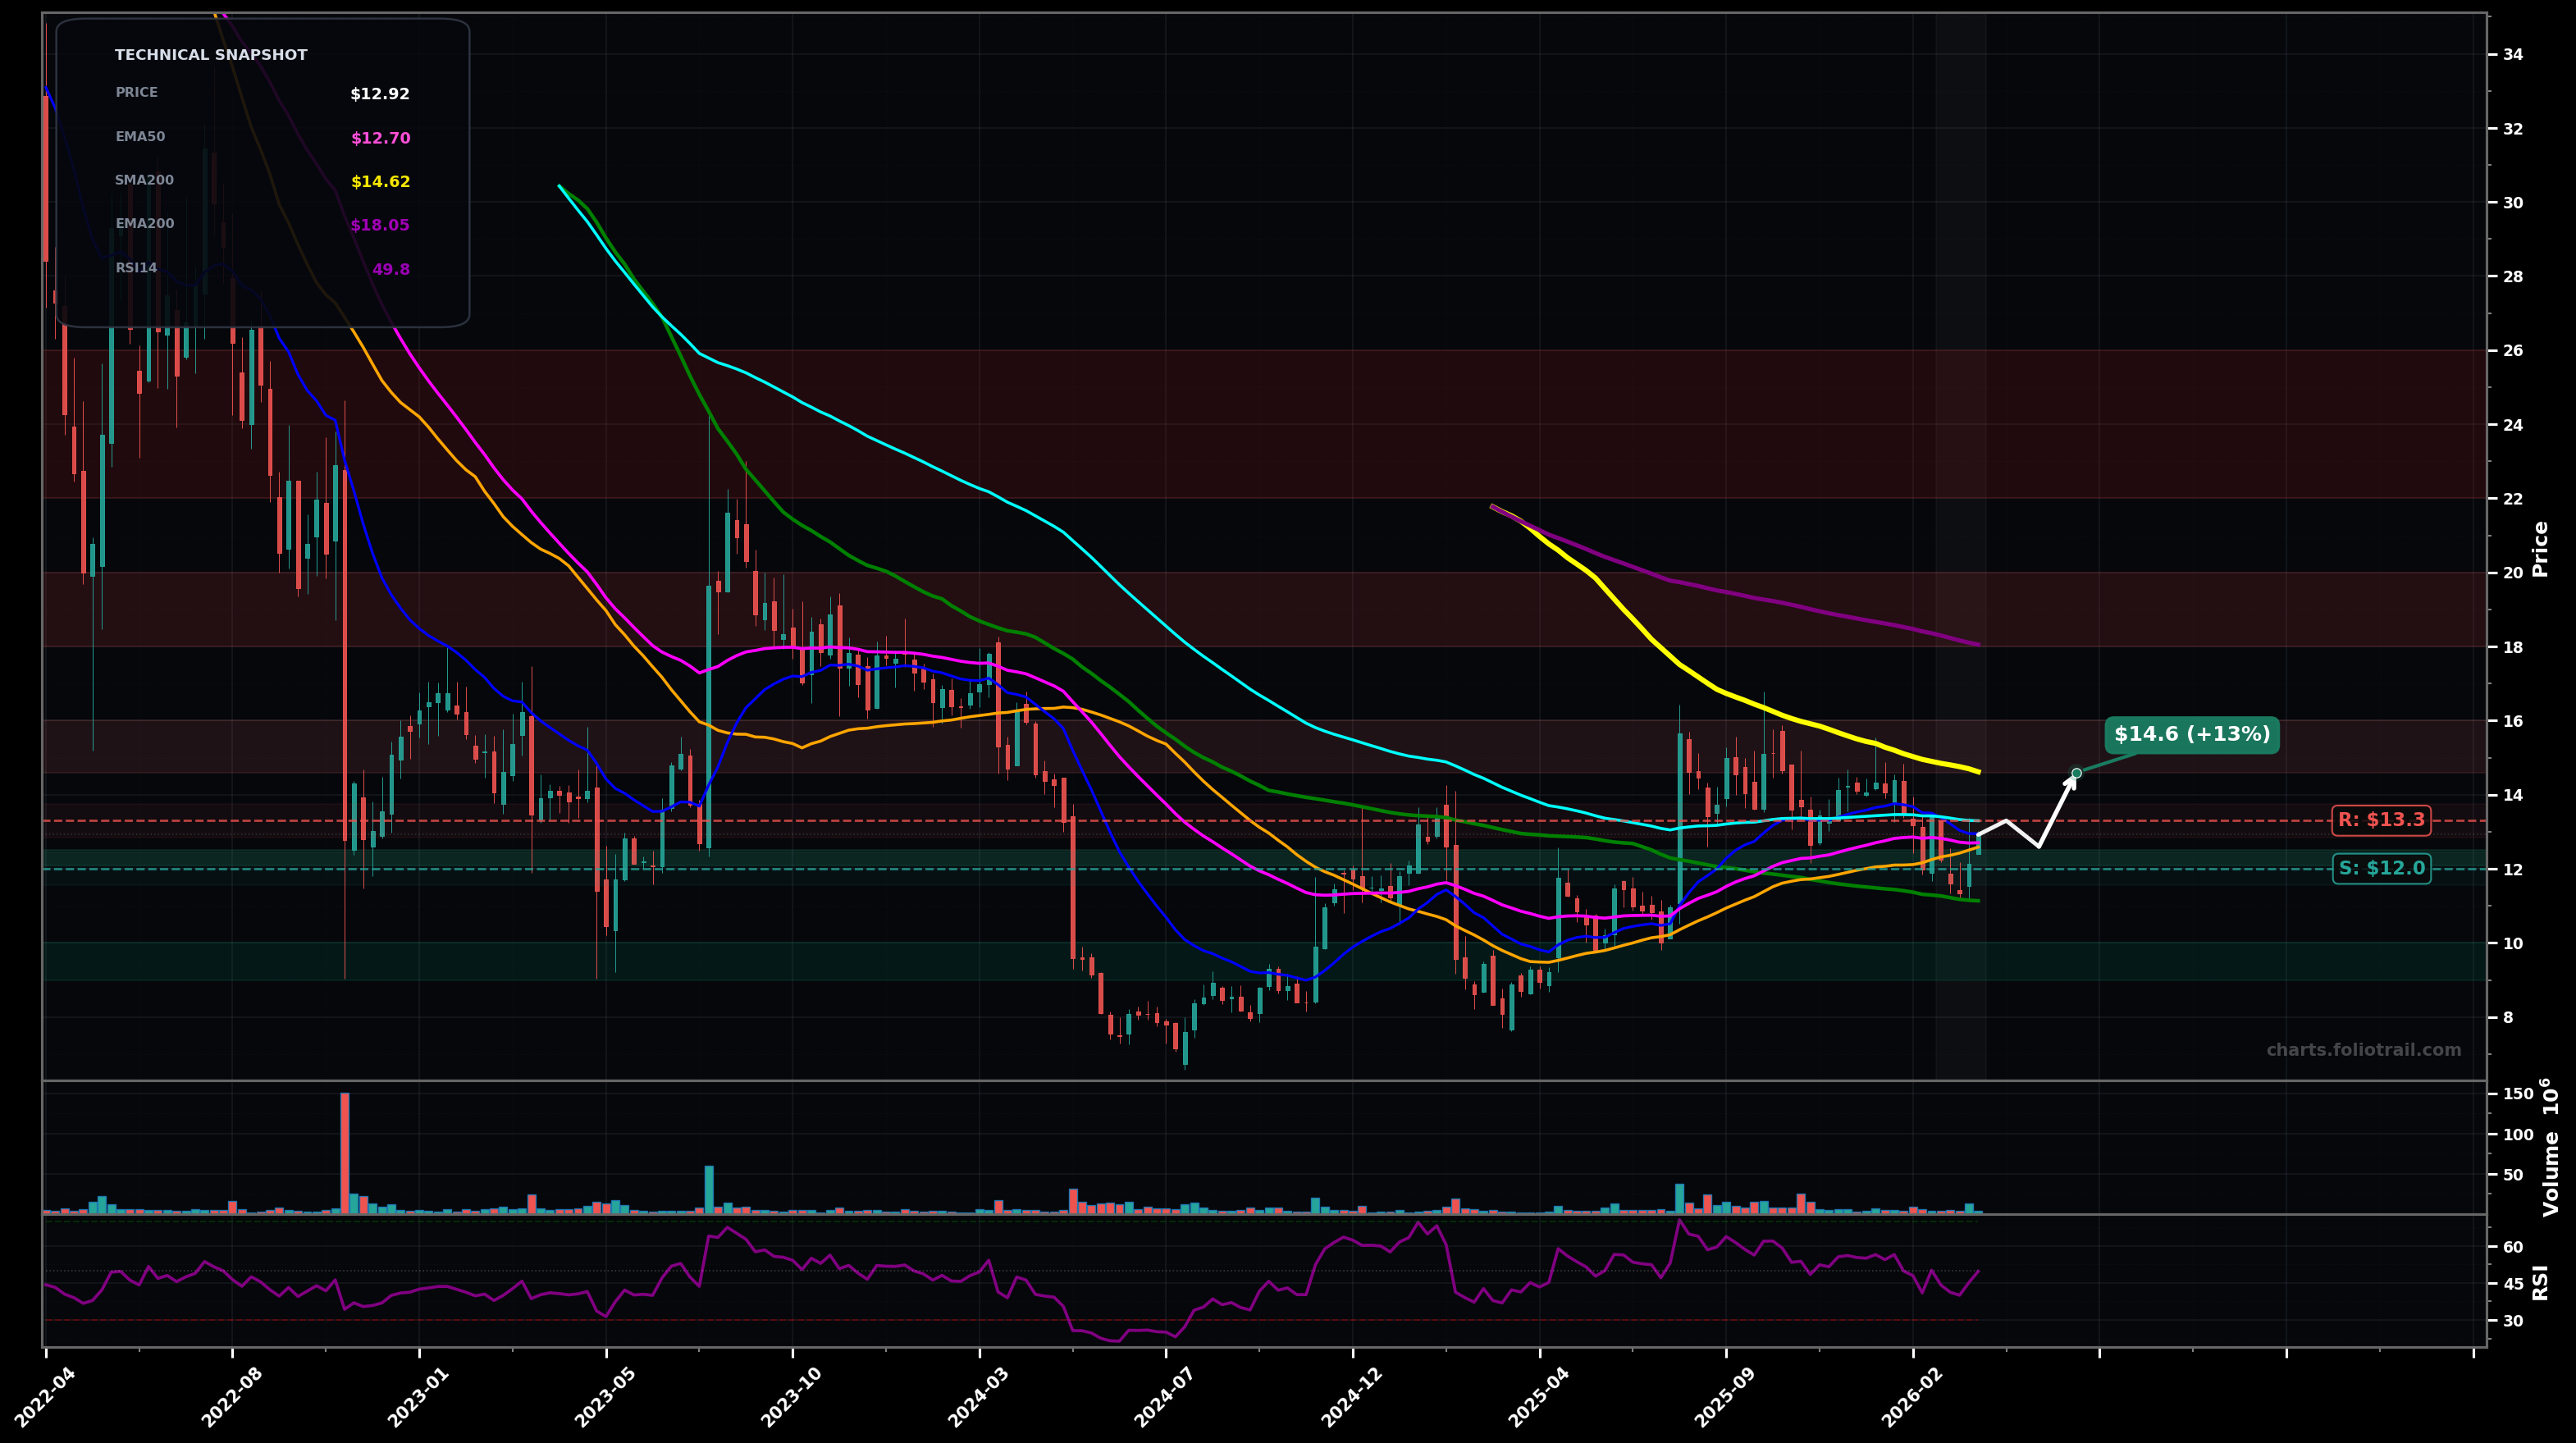
As of March 25, 2026, DLO (DLocal Limited) is in a choppy range state on the weekly chart, with a confidence level of 66%. Key support is at $12.0 and key resistance at $13.3. Price at ~$12.92 is consolidating in a tight weekly range around the cluster of EMA50 (~$12.70) and SMA50 (~$12.59), still below EMA100 (~$13.30) and well below the long-term SMA200 (~$14.62); RSI ~50 suggests neutrality.
Range continuation with a mild bullish bias: hold ~$12.00 support, grind above EMA50, then attempt a breakout through EMA100; if accepted, price rotates toward the SMA200 supply zone (Fib-style mean-reversion to prior breakdown area; Elliott: likely finishing a corrective wave (B)/(2) before attempting (C)/(3) higher).
Bearish rejection: fail at EMA100 (~$13.30) and lose the ~$12.00 range floor, triggering a drop back toward the prior swing-low area; Elliott: corrective rally ends and a new impulsive leg down (wave (3)/(C)) resumes.
2+ weekly closes holding above $13.30 (EMA100) with a push toward $14.60 (SMA200)
Weekly close below $11.80 (range floor / prior pivot support) would shift state toward bearish continuation
Start near EMA50/SMA50 support cluster, add on a clean range-floor retest/undercut near ~$12, heavy add only if a deeper capitulation-style move revisits the prior swing-low demand zone ~$9–$10.
Trim into major overhead MA supply (SMA200 then EMA200) and prior distribution zones; close if price becomes multi-year stretched back into the old upper range where prior breakdowns started.
As of March 25, 2026, DLO (DLocal Limited) is in a choppy range state on the weekly chart with 66% confidence. Price at ~$12.92 is consolidating in a tight weekly range around the cluster of EMA50 (~$12.70) and SMA50 (~$12.59), still below EMA100 (~$13.30) and well below the long-term SMA200 (~$14.62); RSI ~50 suggests neutrality.
On the weekly timeframe, DLO has key support at $12.0 and key resistance at $13.3. The most likely scenario (bullish) targets $13.3 and $14.6, with a revert level at $12.6.
DLO (DLocal Limited) is currently classified as choppy range on the weekly chart, with 66% confidence. Confirmation requires: 2+ weekly closes holding above $13.30 (EMA100) with a push toward $14.60 (SMA200) This would be invalidated by: Weekly close below $11.80 (range floor / prior pivot support) would shift state toward bearish continuation
The most likely scenario (bullish) targets $13.3 and $14.6, with a revert level at $12.6. The alternative scenario (bearish) targets $11.8 and $9.20.
Multi-layer AI agents analyse 200+ stocks across daily, weekly, and monthly timeframes — producing market state classifications, price scenarios with targets, and position entry/exit levels. Updated every trading day after market close. No paywall. No sign-up required.
Built by Foliotrail.
All content on this website — including charts, analysis, price targets, support/resistance levels, and position zones — is generated entirely by AI and provided for educational and informational purposes only.
This is not financial advice. NEXUSNOIR VENTURES SL (the operator of this website) is not a registered investment adviser or broker-dealer. You should not make investment decisions based solely on this information. Always do your own research and consult a qualified financial advisor.
By continuing, you acknowledge that you have read and agree to our full disclaimer & terms of use and privacy policy.