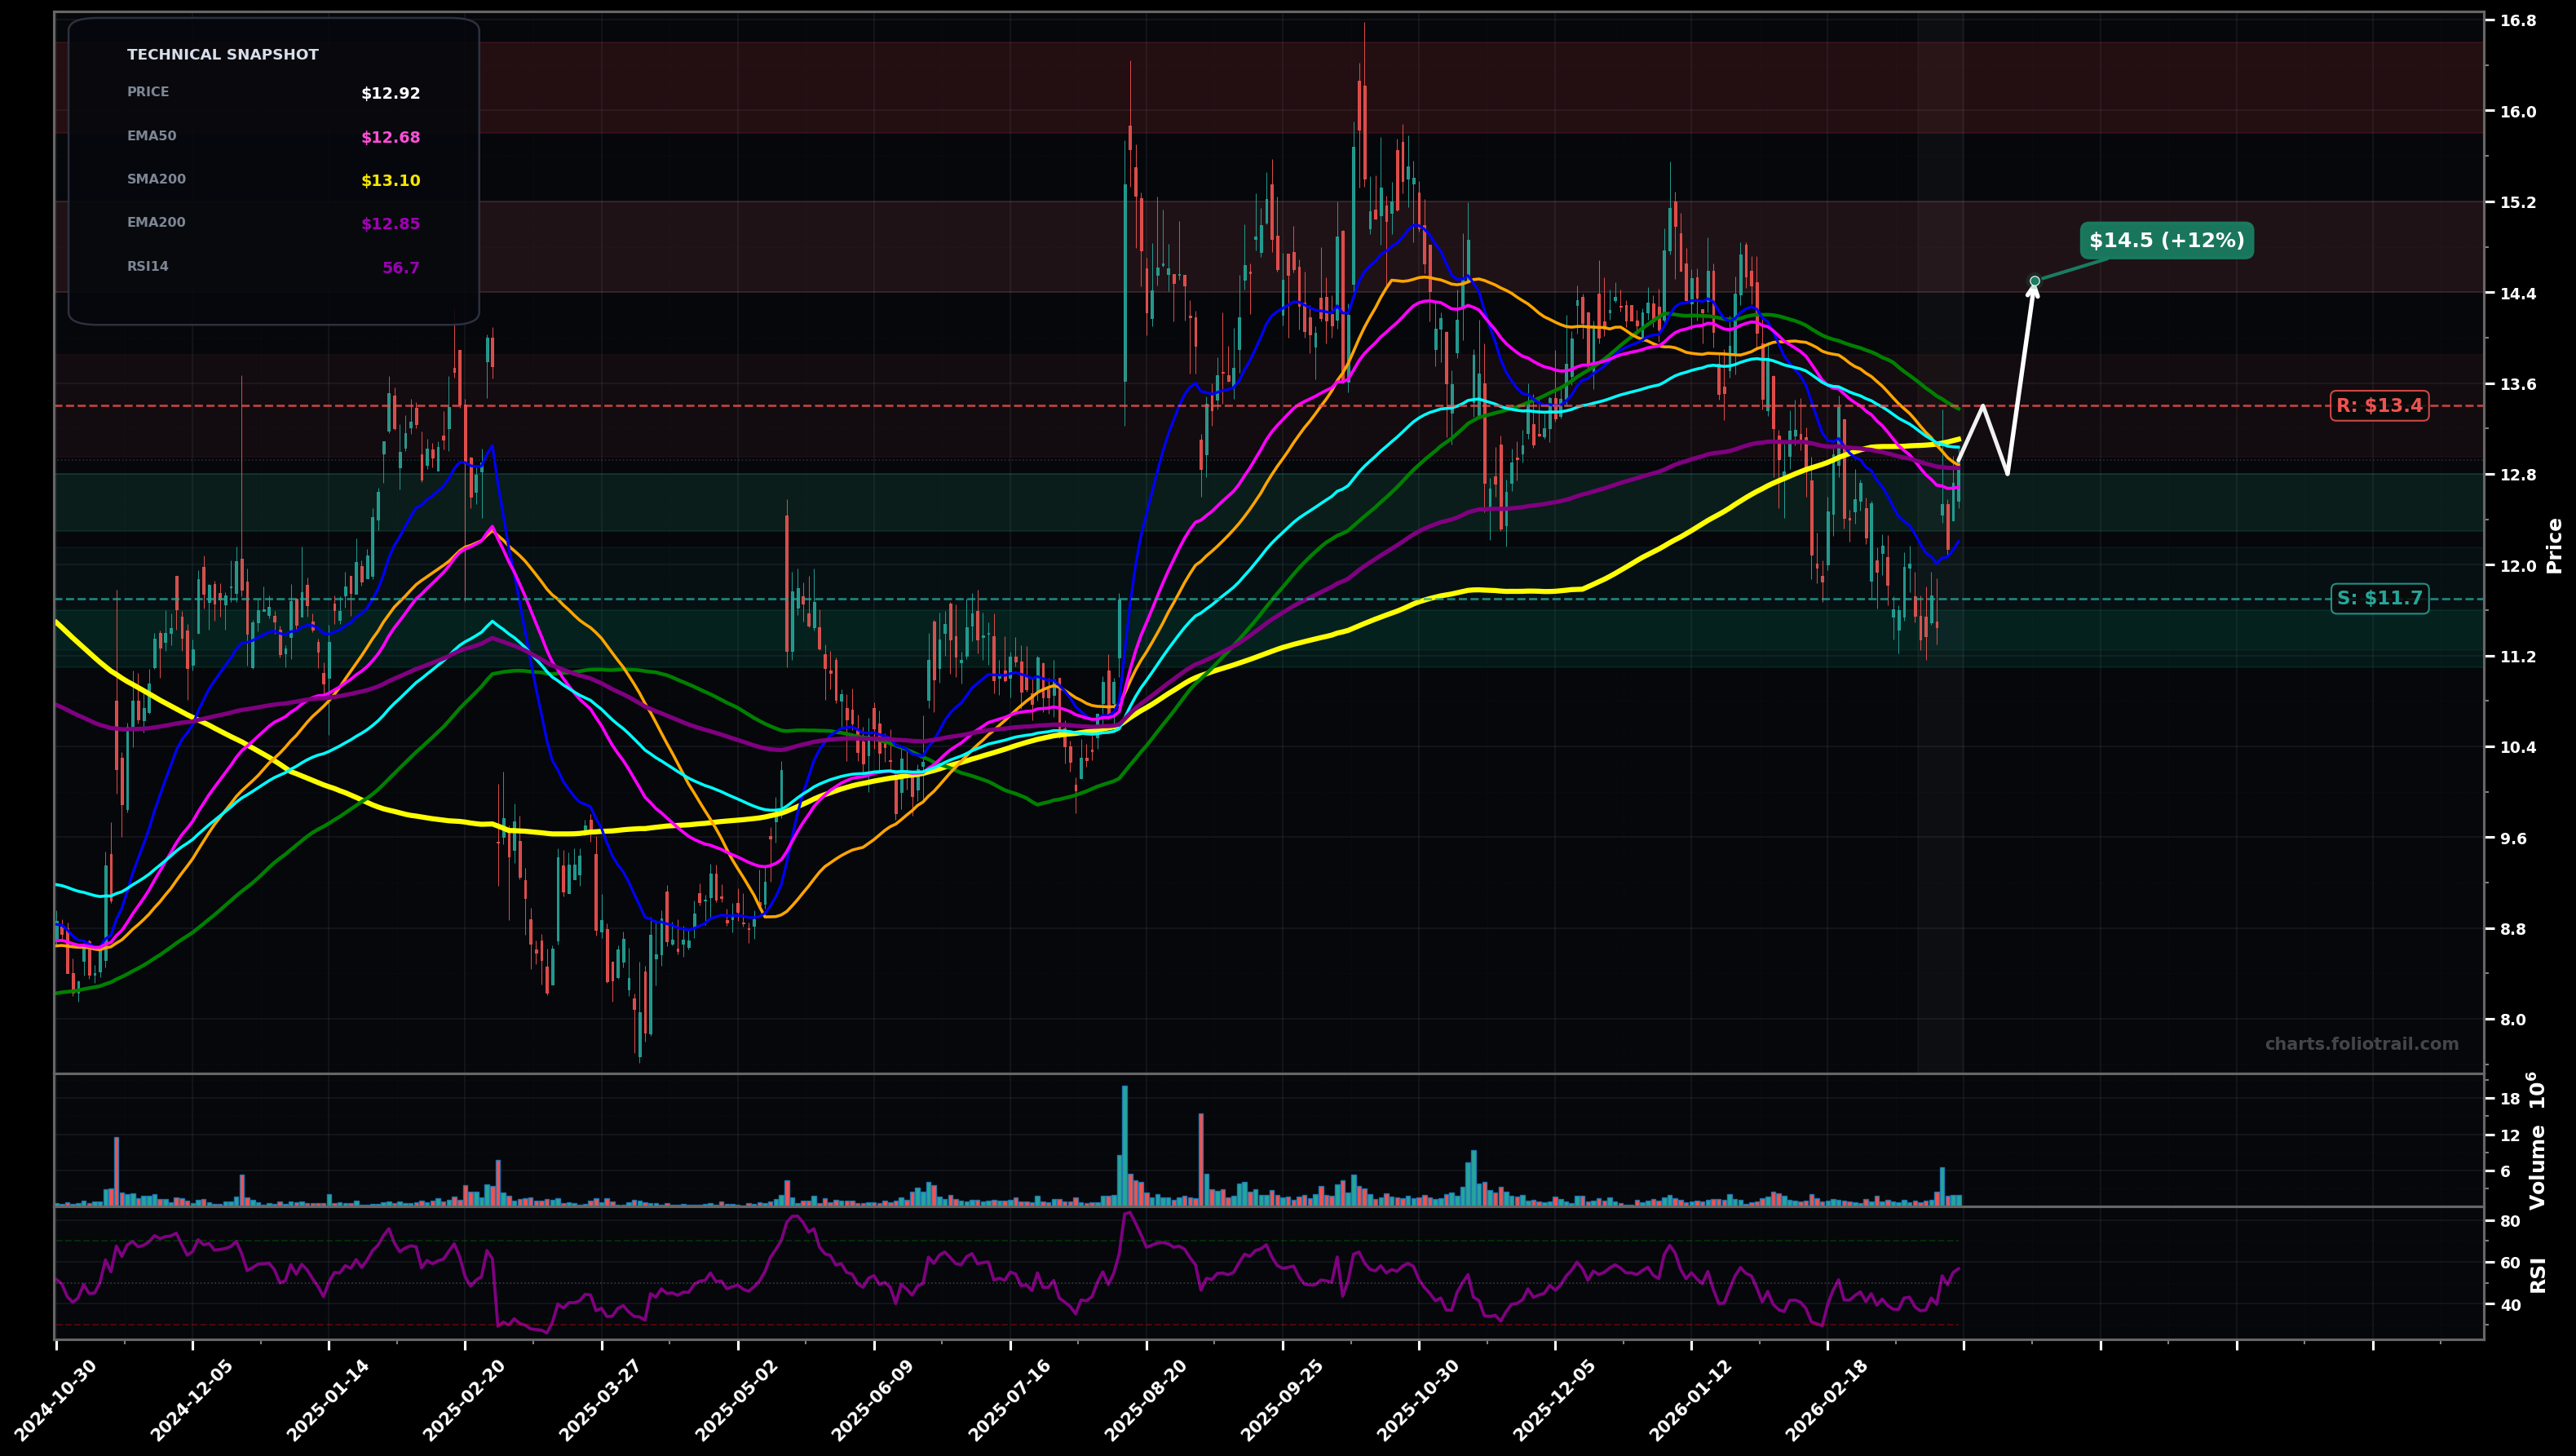
As of March 25, 2026, DLO (DLocal Limited) is in a bottoming attempt state on the daily chart, with a confidence level of 62%. Key support is at $11.7 and key resistance at $13.4. After a down-swing from ~$14.5 into a ~$11.7–$12.0 swing low, price rebounded to ~$12.92 and is trying to push back into the clustered 50/100/200-day averages; RSI recovered to ~56.
Base-to-breakout attempt: price grinds higher through the MA cluster, retests the breakout area, then continues toward the prior breakdown supply zone. (Rough probability: 60%)
Failed reclaim: rejection at the MA cluster leads to a rollover and retest of the recent swing-low support; if lost, continuation down resumes. (Rough probability: 40%)
Daily closes reclaim and hold above ~$13.40 (2+ closes) to flip into a breakout-reversal bias
Daily close below ~$11.70 (break of the recent swing low) shifts back toward downdtrend risk
Start near reclaimed EMA50/SMA50 area; add on controlled pullback into the swing-low support; heavy-add only on deeper flush toward next support (risk-managed) while trend is still not confirmed.
Trim into prior supply/previous swing highs (likely fib retracement zones of the $16→$11.7 decline); progressively derisk if price gets extended above long MAs and approaches historical overhead resistance.
As of March 25, 2026, DLO (DLocal Limited) is in a bottoming attempt state on the daily chart with 62% confidence. After a down-swing from ~$14.5 into a ~$11.7–$12.0 swing low, price rebounded to ~$12.92 and is trying to push back into the clustered 50/100/200-day averages; RSI recovered to ~56.
On the daily timeframe, DLO has key support at $11.7 and key resistance at $13.4. The most likely scenario (bullish) targets $13.4 and $14.5, with a revert level at $12.8.
DLO (DLocal Limited) is currently classified as bottoming attempt on the daily chart, with 62% confidence. Confirmation requires: Daily closes reclaim and hold above ~$13.40 (2+ closes) to flip into a breakout-reversal bias This would be invalidated by: Daily close below ~$11.70 (break of the recent swing low) shifts back toward downdtrend risk
The most likely scenario (bullish) targets $13.4 and $14.5, with a revert level at $12.8. The alternative scenario (bearish) targets $12.1 and $11.2.
Multi-layer AI agents analyse 200+ stocks across daily, weekly, and monthly timeframes — producing market state classifications, price scenarios with targets, and position entry/exit levels. Updated every trading day after market close. No paywall. No sign-up required.
Built by Foliotrail.
All content on this website — including charts, analysis, price targets, support/resistance levels, and position zones — is generated entirely by AI and provided for educational and informational purposes only.
This is not financial advice. NEXUSNOIR VENTURES SL (the operator of this website) is not a registered investment adviser or broker-dealer. You should not make investment decisions based solely on this information. Always do your own research and consult a qualified financial advisor.
By continuing, you acknowledge that you have read and agree to our full disclaimer & terms of use and privacy policy.