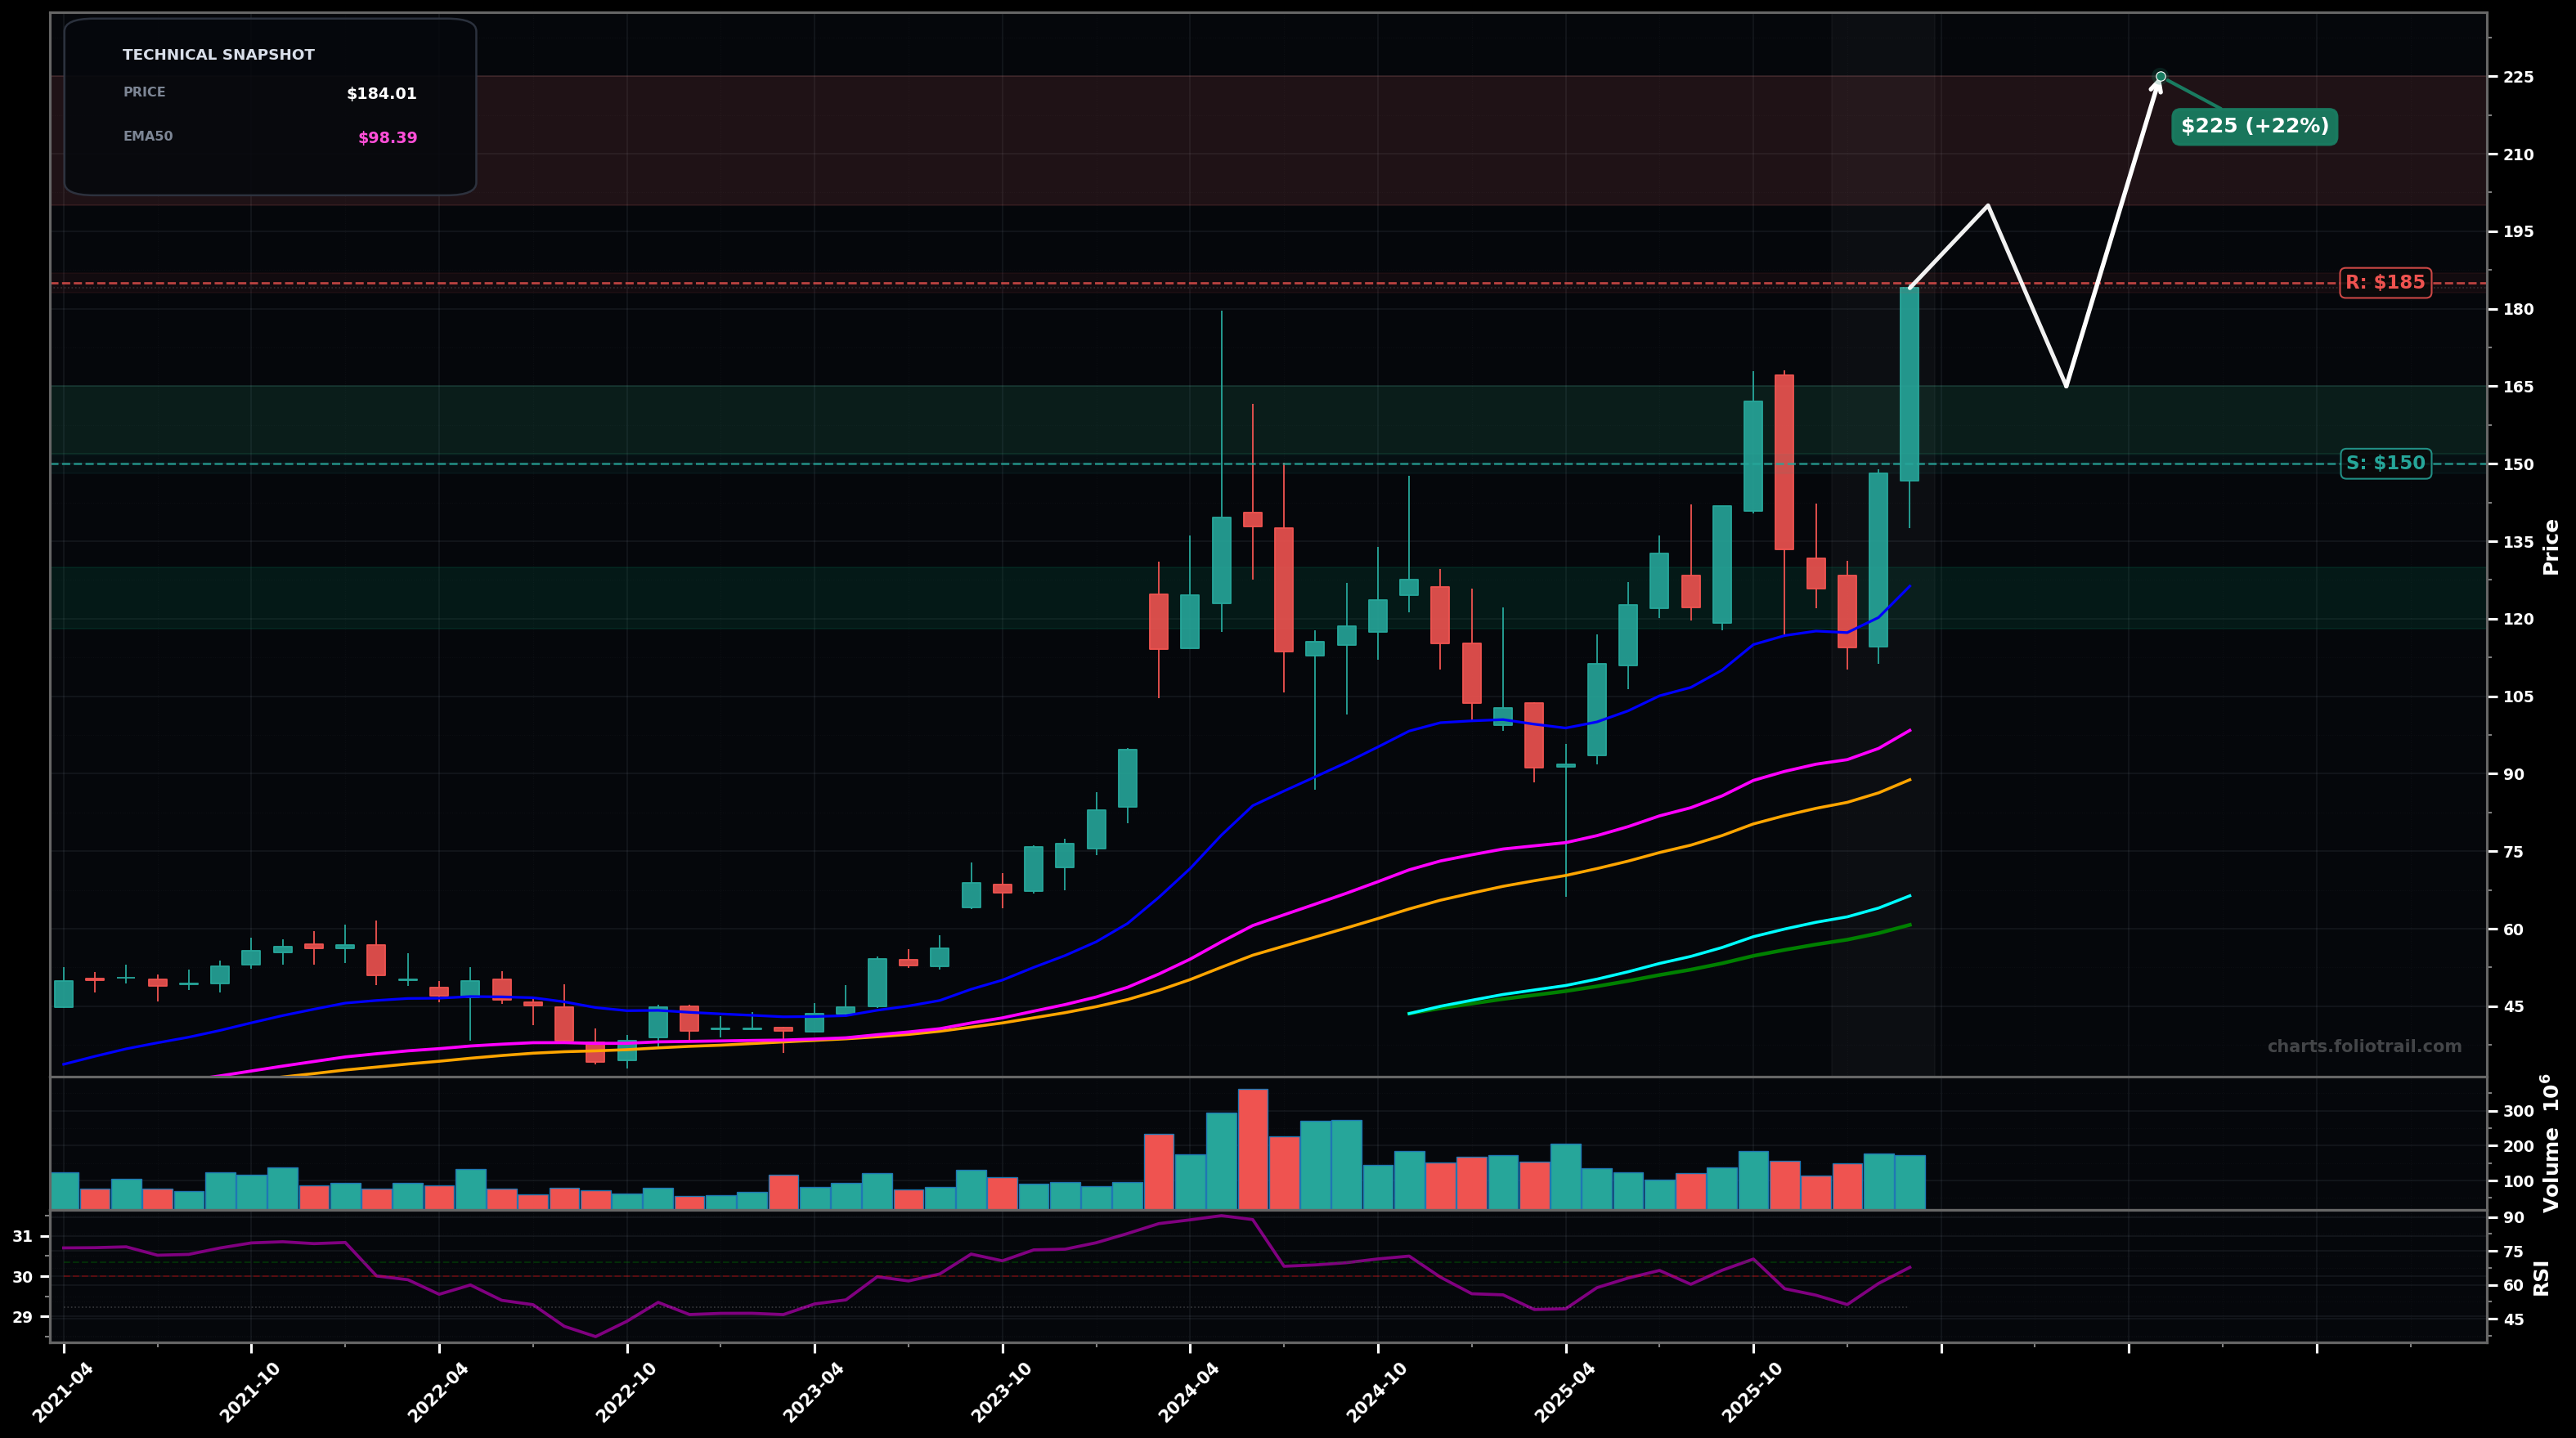
As of March 26, 2026, DELL (Dell Technologies Inc.) is in a uptrend state on the monthly chart, with a confidence level of 73%. Key support is at $150 and key resistance at $185. Monthly breakout to new swing high with strong green follow-through; price extended above rising EMA50/EMA100 and all shorter SMAs.
Bullish continuation after breakout: brief consolidation/pullback that holds above the breakout area, then pushes to a new high (Elliott: late Wave 3 or start of Wave 5 extension; Fib next expansion zone).
Deeper monthly pullback (Wave 4-style) toward the rising EMA50 area; price chops then attempts a re-breakout if support holds (risk elevated due to being extended from EMA50 and RSI ~upper-60s).
Hold above $165 on monthly closes (no loss of the breakout zone).
Monthly close back below $150 (breakdown under prior breakout + loss of momentum).
Start/add/heavy-add mapped to (1) breakout retest zone, (2) prior pivot support, (3) deeper Wave-4/EMA50-EMA20 mean-reversion area while keeping trend intact.
Trim into Fib extension/psychological levels as price gets increasingly stretched above EMA50/EMA100; close only if a blow-off extension prints into far extensions (high reversal risk).
As of March 26, 2026, DELL (Dell Technologies Inc.) is in a uptrend state on the monthly chart with 73% confidence. Monthly breakout to new swing high with strong green follow-through; price extended above rising EMA50/EMA100 and all shorter SMAs.
On the monthly timeframe, DELL has key support at $150 and key resistance at $185. The most likely scenario (bullish) targets $200 and $225, with a revert level at $165.
DELL (Dell Technologies Inc.) is currently classified as uptrend on the monthly chart, with 73% confidence. Confirmation requires: Hold above $165 on monthly closes (no loss of the breakout zone). This would be invalidated by: Monthly close back below $150 (breakdown under prior breakout + loss of momentum).
The most likely scenario (bullish) targets $200 and $225, with a revert level at $165. The alternative scenario (bearish) targets $150 and $125.
Multi-layer AI agents analyse 200+ stocks across daily, weekly, and monthly timeframes — producing market state classifications, price scenarios with targets, and position entry/exit levels. Updated every trading day after market close. No paywall. No sign-up required.
Built by Foliotrail.
All content on this website — including charts, analysis, price targets, support/resistance levels, and position zones — is generated entirely by AI and provided for educational and informational purposes only.
This is not financial advice. NEXUSNOIR VENTURES SL (the operator of this website) is not a registered investment adviser or broker-dealer. You should not make investment decisions based solely on this information. Always do your own research and consult a qualified financial advisor.
By continuing, you acknowledge that you have read and agree to our full disclaimer & terms of use and privacy policy.