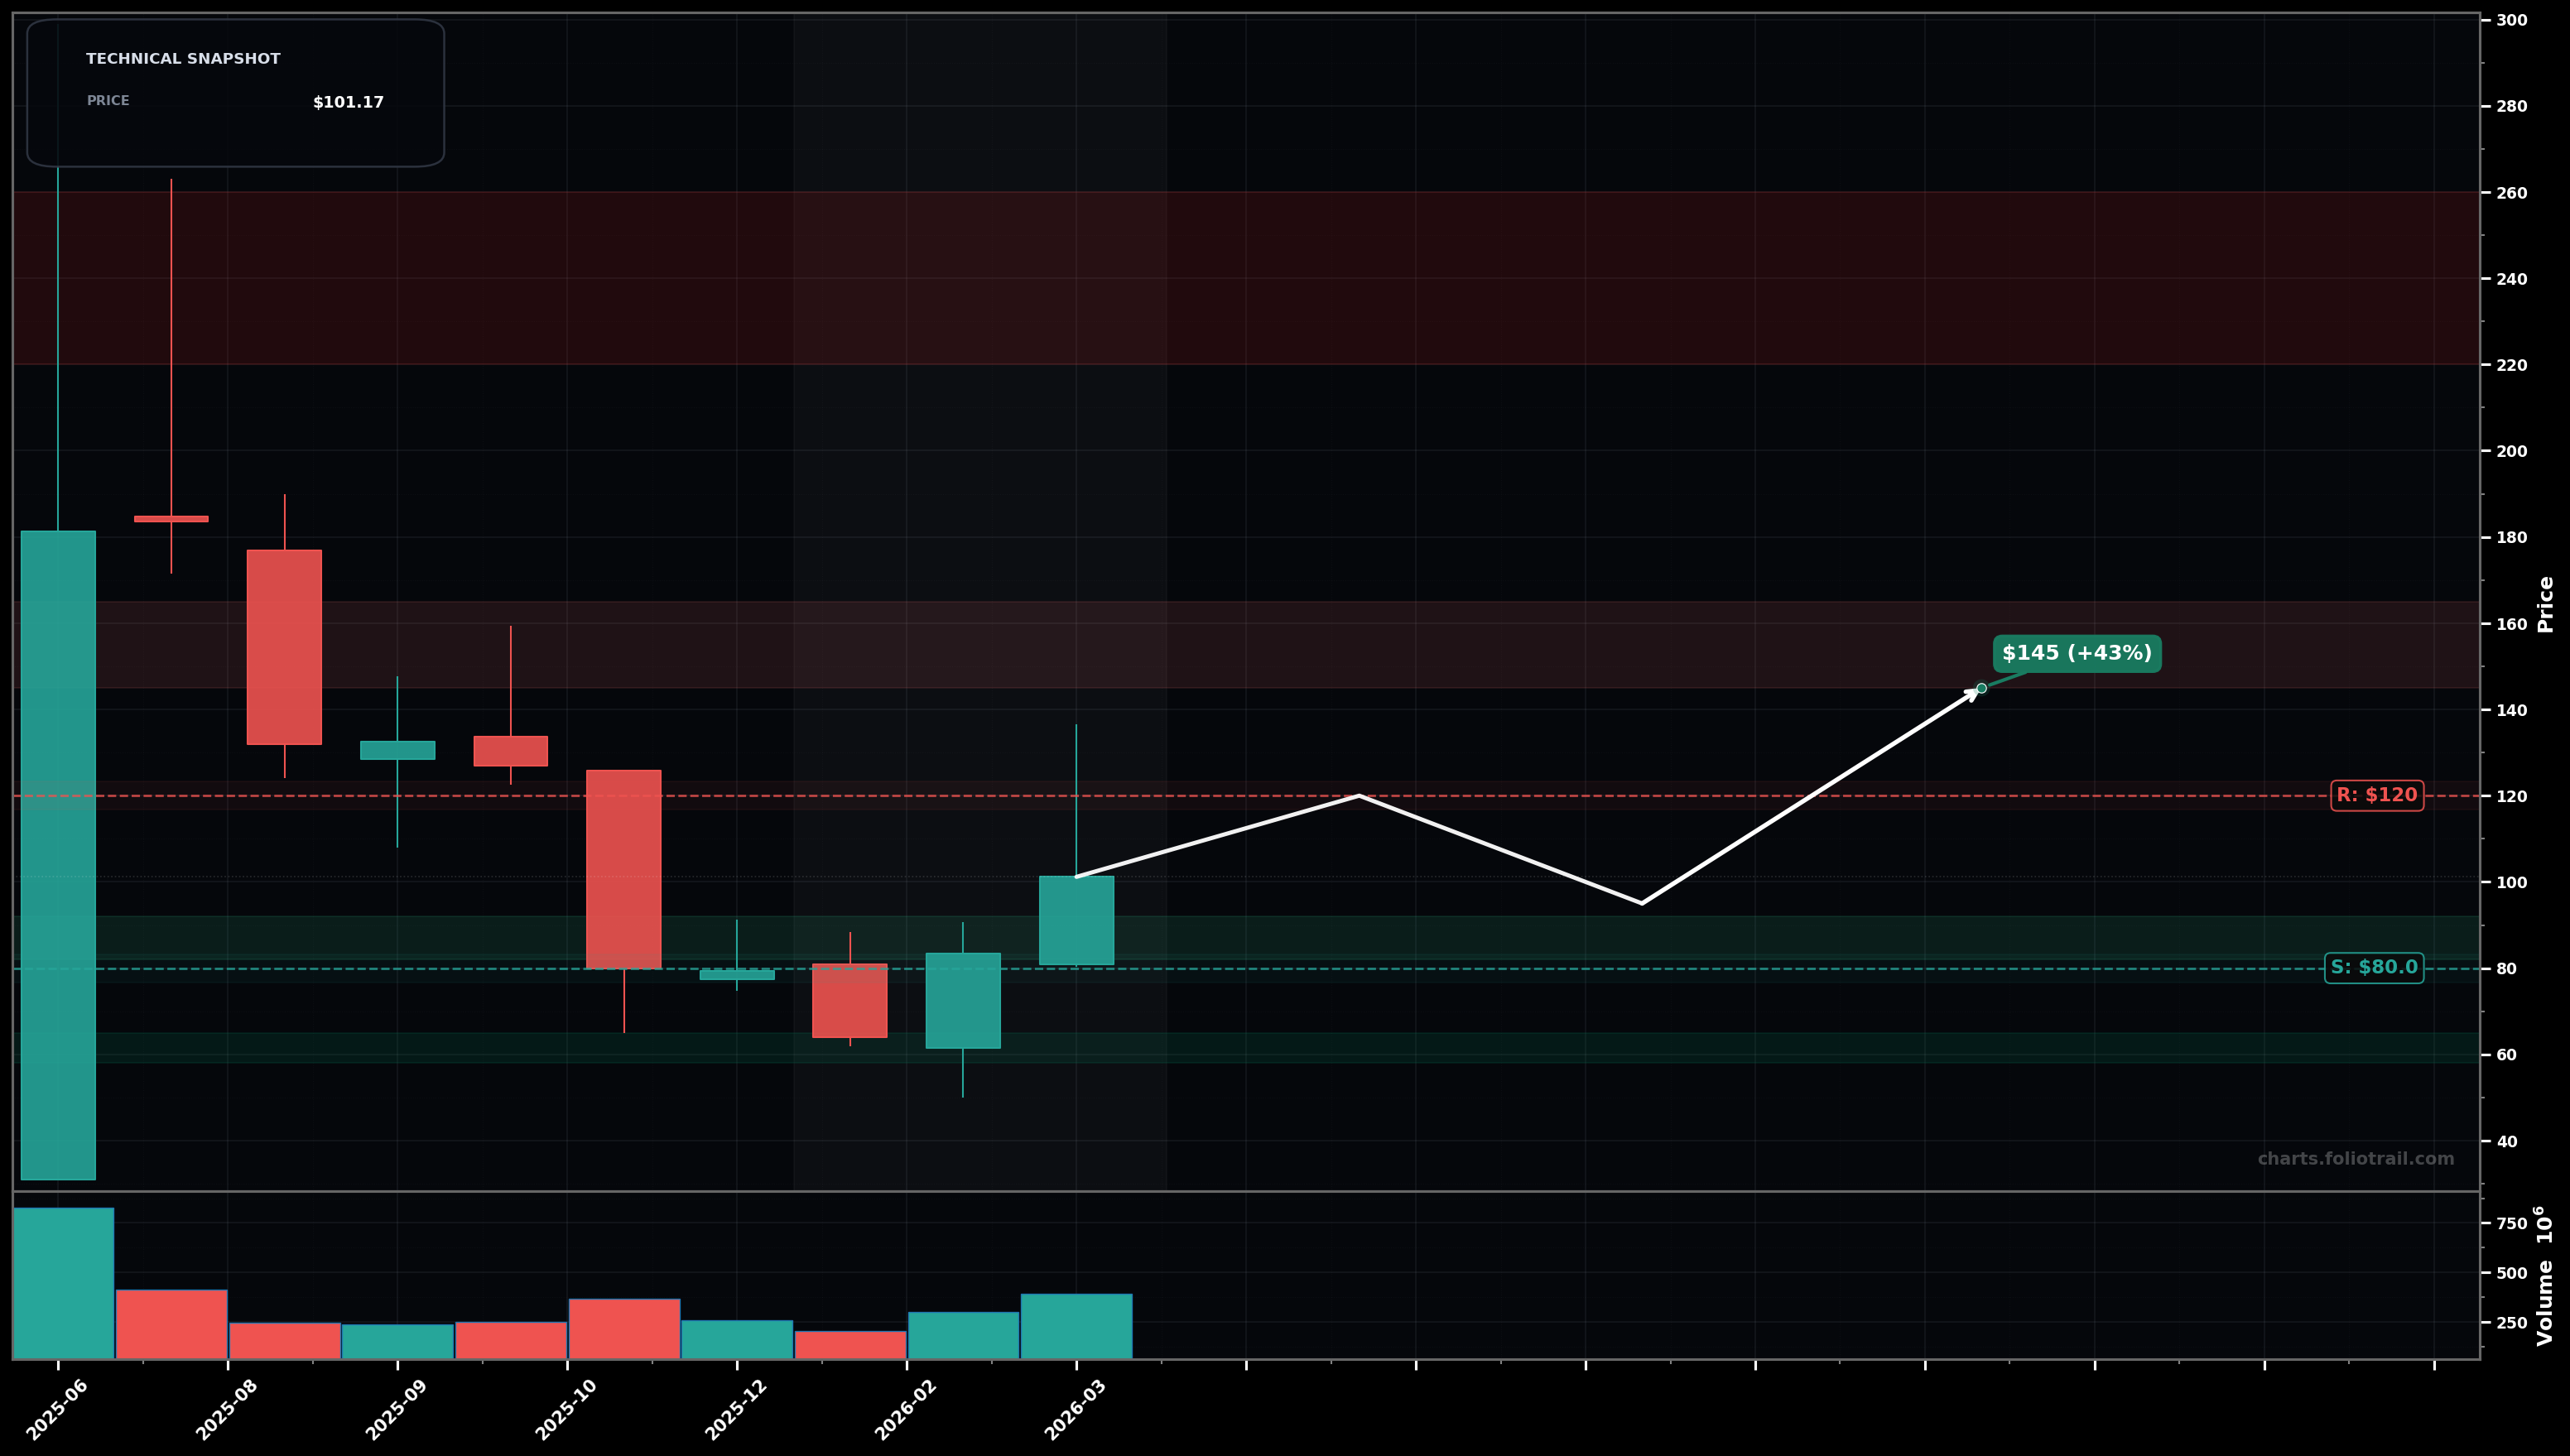
As of March 25, 2026, CRCL (Circle Internet Group, Inc.) is in a bottoming attempt state on the monthly chart, with a confidence level of 62%. Key support is at $80.0 and key resistance at $120. After a sharp selloff from the $180–$190 area to a swing low near $55–$60, monthly candles show a bounce back to ~$101 with improving green closes but still below prior breakdown supply.
Base-building continuation: price chops/holds above ~$80, then pushes through the ~$120 supply zone; this fits an Elliott Wave view of a developing A-B-C rebound where C attempts to extend toward key Fib retracement levels of the prior drop.
Failure at resistance: price rejects around ~$110–$120 and rolls over for a retest of the prior swing-low zone; would align with the rebound being only a Wave B (or corrective bounce) before another leg down.
Monthly close above $120 with follow-through (next month holds >$120)
Monthly close below $60
Stage entries around the $80 pivot/support and prior consolidation; add more on a controlled retest; heavy add only near the swing-low demand zone ($60 area) where reward/risk improves.
Trim into major overhead supply and Fib retracement bands from the $180–$190 swing; full exit reserved for a stretched multi-year extension back into the upper prior-range distribution zone.
As of March 25, 2026, CRCL (Circle Internet Group, Inc.) is in a bottoming attempt state on the monthly chart with 62% confidence. After a sharp selloff from the $180–$190 area to a swing low near $55–$60, monthly candles show a bounce back to ~$101 with improving green closes but still below prior breakdown supply.
On the monthly timeframe, CRCL has key support at $80.0 and key resistance at $120. The most likely scenario (bullish) targets $120 and $145, with a revert level at $95.0.
CRCL (Circle Internet Group, Inc.) is currently classified as bottoming attempt on the monthly chart, with 62% confidence. Confirmation requires: Monthly close above $120 with follow-through (next month holds >$120) This would be invalidated by: Monthly close below $60
The most likely scenario (bullish) targets $120 and $145, with a revert level at $95.0. The alternative scenario (bearish) targets $80.0 and $60.0.
Multi-layer AI agents analyse 200+ stocks across daily, weekly, and monthly timeframes — producing market state classifications, price scenarios with targets, and position entry/exit levels. Updated every trading day after market close. No paywall. No sign-up required.
Built by Foliotrail.
All content on this website — including charts, analysis, price targets, support/resistance levels, and position zones — is generated entirely by AI and provided for educational and informational purposes only.
This is not financial advice. NEXUSNOIR VENTURES SL (the operator of this website) is not a registered investment adviser or broker-dealer. You should not make investment decisions based solely on this information. Always do your own research and consult a qualified financial advisor.
By continuing, you acknowledge that you have read and agree to our full disclaimer & terms of use and privacy policy.