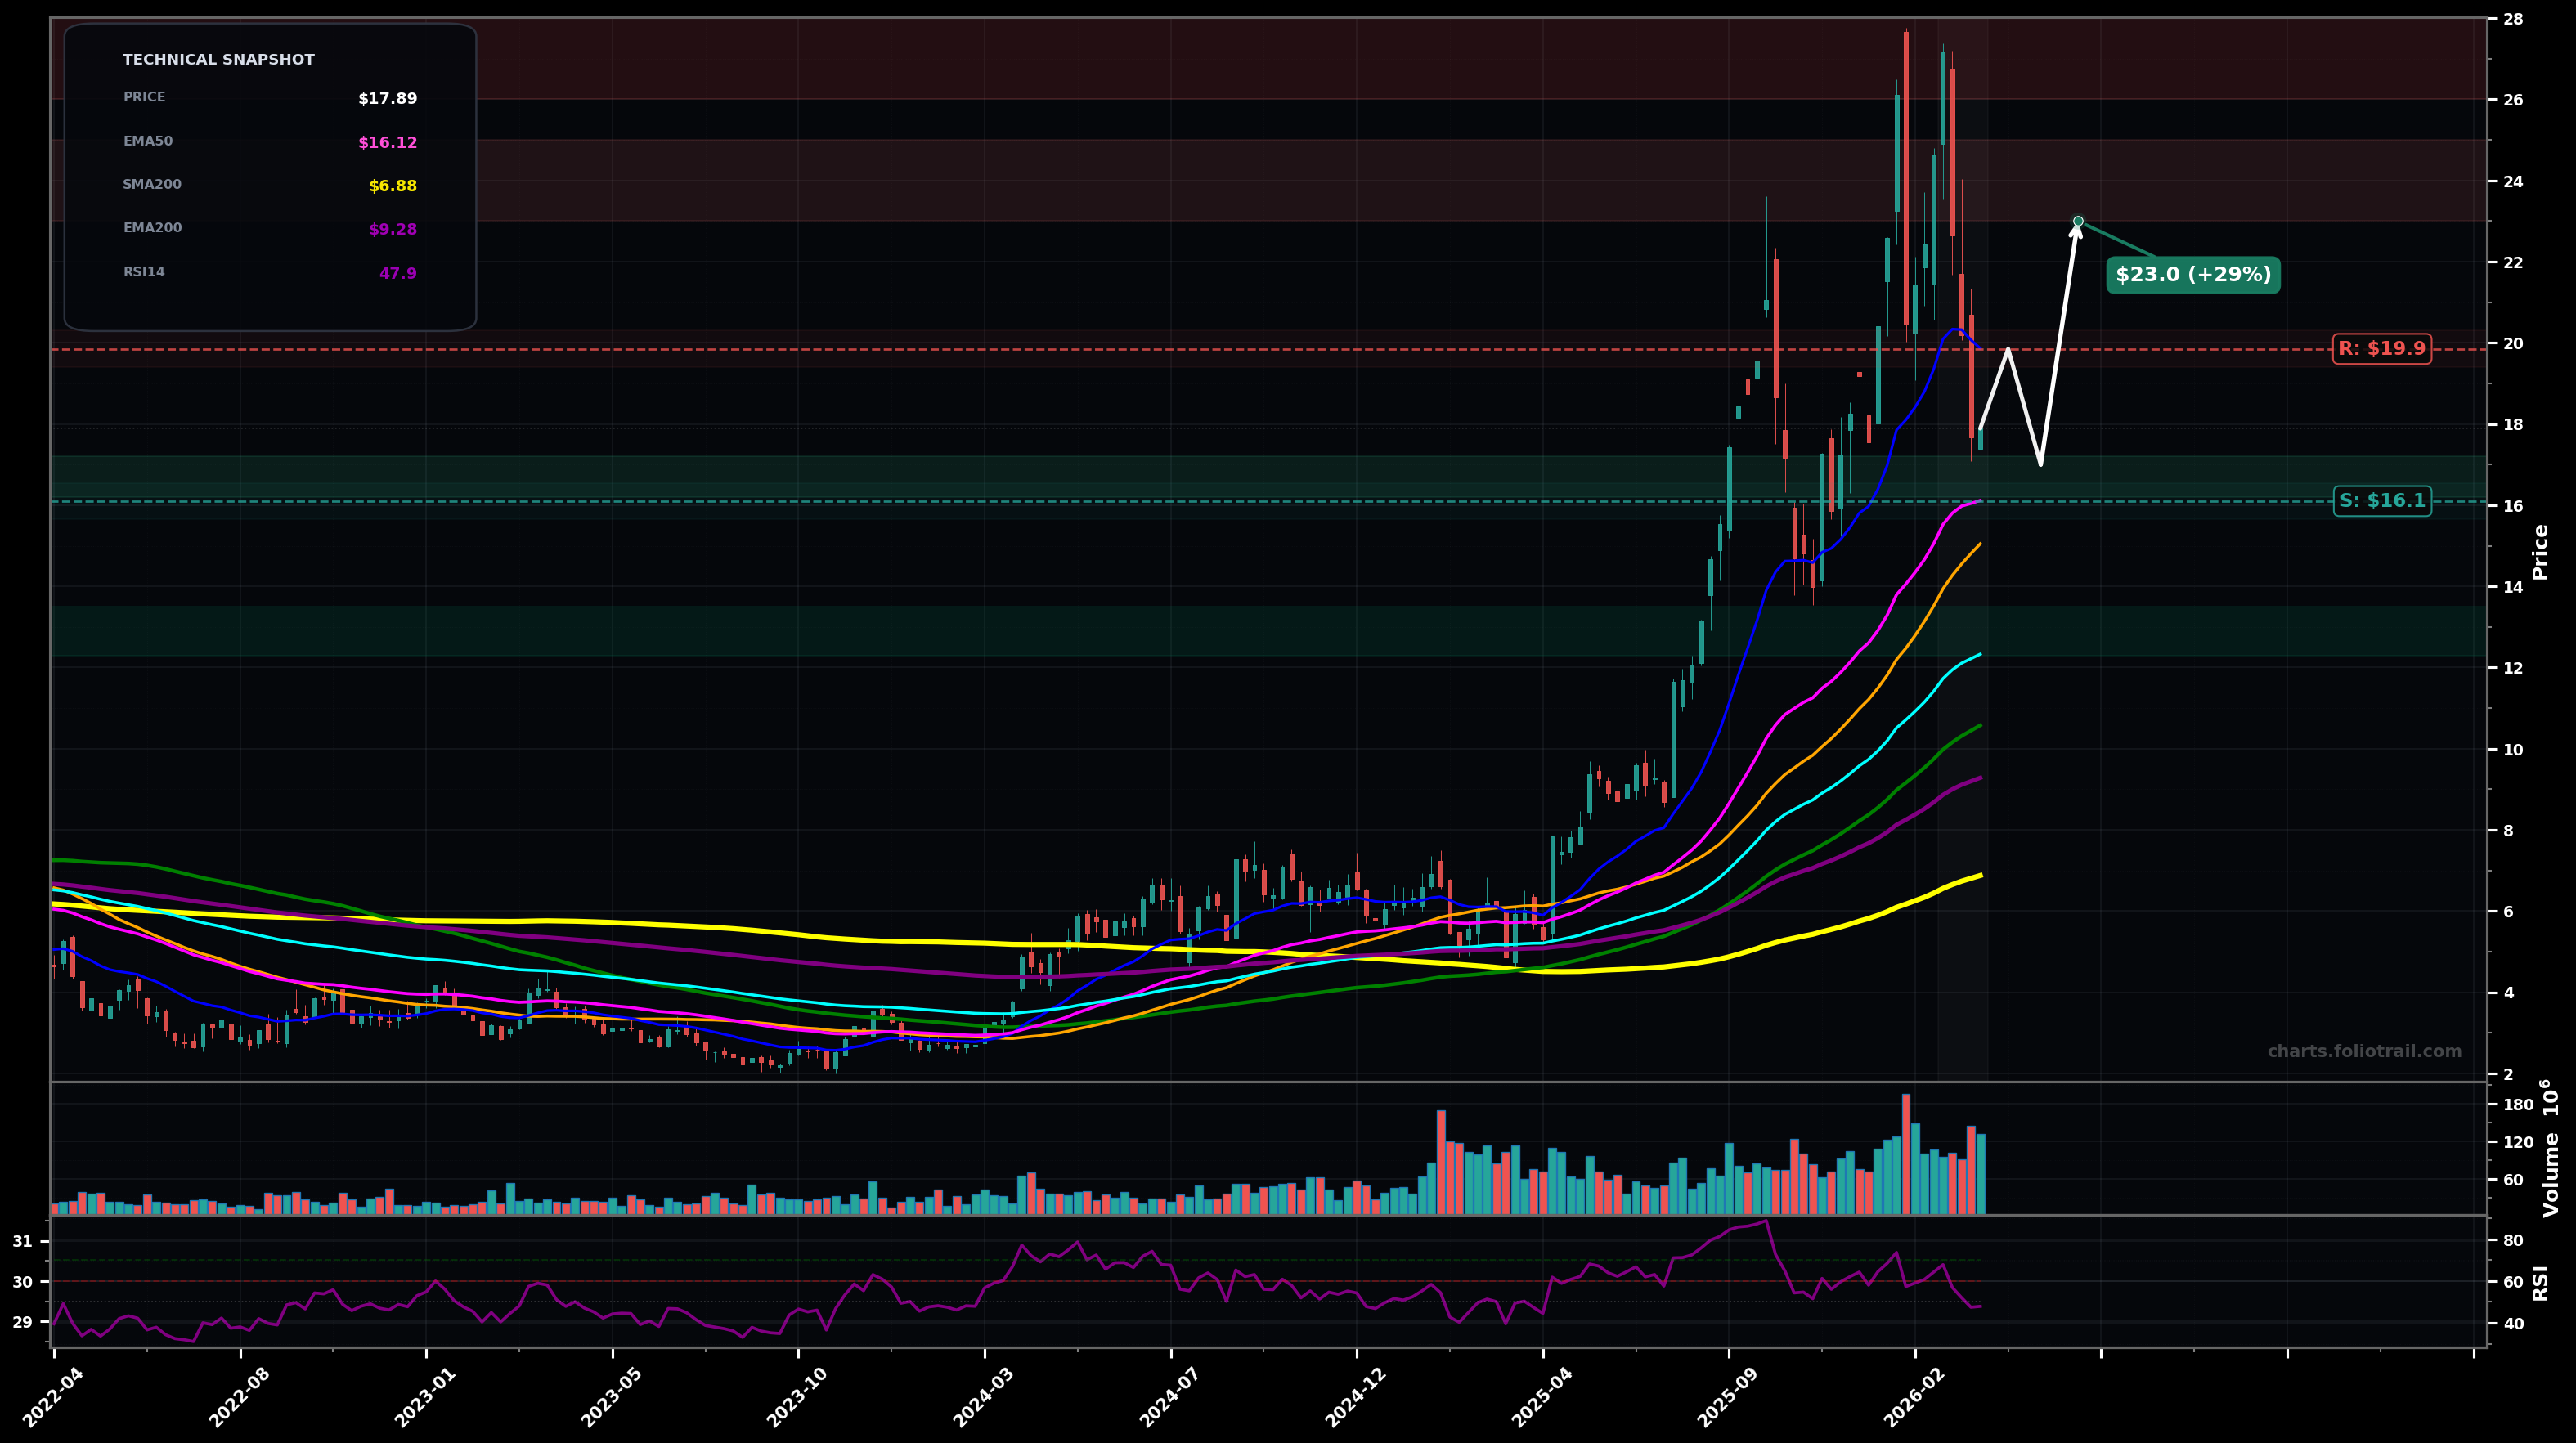
As of March 24, 2026, CDE (Coeur Mining, Inc.) is in a volatility expansion state on the weekly chart, with a confidence level of 72%. Key support is at $16.1 and key resistance at $19.9. Sharp pullback from the ~$27-$28 spike, now consolidating around ~$18 with RSI-14 near ~48 and price still above rising longer-term MAs.
Mean-reversion bounce and range-build: hold EMA50 (~$16.10) then reclaim ~$20 (EMA20) to work back into the prior breakdown zone.
Deeper retrace of the entire impulse: failure to reclaim ~$20 leads to a breakdown through EMA50, seeking the next confluence near EMA100/SMA50 area.
Expansion continues if a weekly close breaks above $20.00 or below $16.10.
Volatility-expansion view weakens if price compresses for several weeks and holds $16.10-$20.00 with shrinking ranges (base forms).
Buy bias only on pullbacks into MA/Fib confluence: EMA50 (~$16.1) first, then SMA50/EMA100 (~$15/$12.3) if volatility flushes lower.
Trim into prior supply/extension: ~$23 retest zone first, then the blow-off top area ~$26-$28; full exit reserved for an overshoot above prior highs.
As of March 24, 2026, CDE (Coeur Mining, Inc.) is in a volatility expansion state on the weekly chart with 72% confidence. Sharp pullback from the ~$27-$28 spike, now consolidating around ~$18 with RSI-14 near ~48 and price still above rising longer-term MAs.
On the weekly timeframe, CDE has key support at $16.1 and key resistance at $19.9. The most likely scenario (bullish) targets $19.9 and $23.0, with a revert level at $17.0.
CDE (Coeur Mining, Inc.) is currently classified as volatility expansion on the weekly chart, with 72% confidence. Confirmation requires: Expansion continues if a weekly close breaks above $20.00 or below $16.10. This would be invalidated by: Volatility-expansion view weakens if price compresses for several weeks and holds $16.10-$20.00 with shrinking ranges (base forms).
The most likely scenario (bullish) targets $19.9 and $23.0, with a revert level at $17.0. The alternative scenario (bearish) targets $15.1 and $12.3.
All content on this website — including charts, analysis, price targets, support/resistance levels, and position zones — is generated entirely by AI and provided for educational and informational purposes only.
This is not financial advice. NEXUSNOIR VENTURES SL (the operator of this website) is not a registered investment adviser or broker-dealer. You should not make investment decisions based solely on this information. Always do your own research and consult a qualified financial advisor.
By continuing, you acknowledge that you have read and agree to our full disclaimer & terms of use and privacy policy.