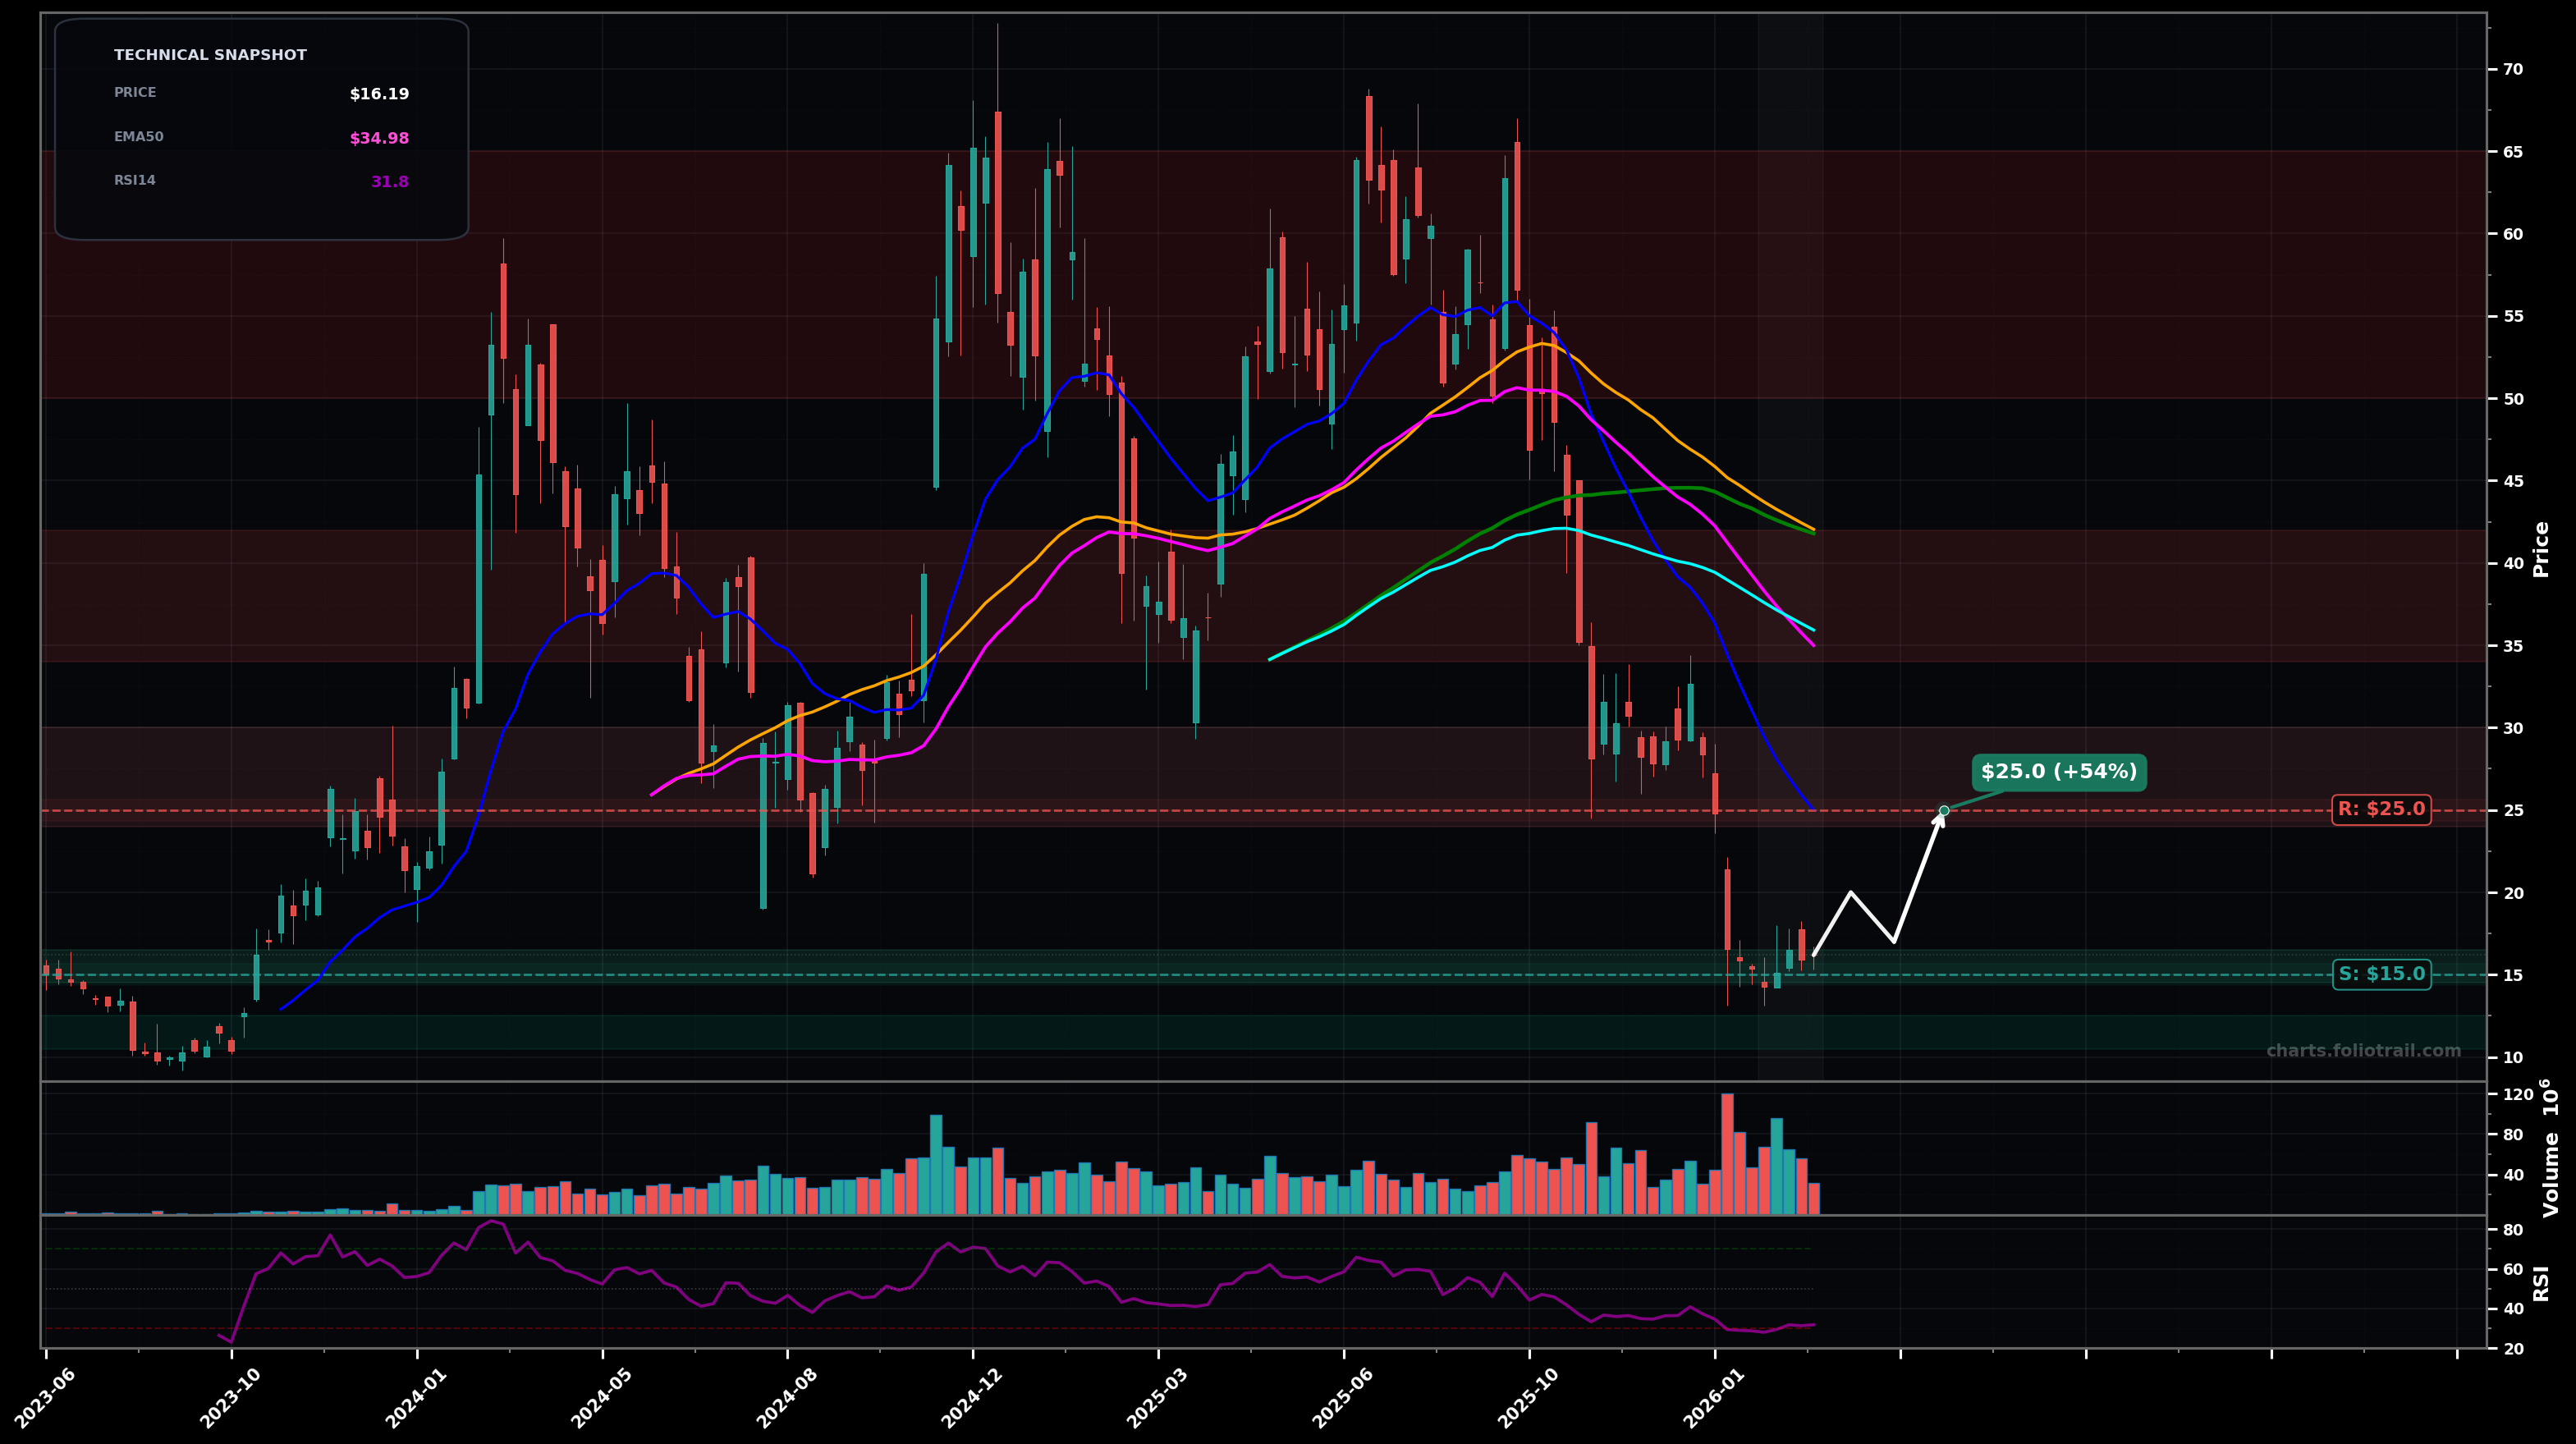
As of March 26, 2026, BITX (2X BITCOIN STRATEGY ETF) is in a falling knife state on the weekly chart, with a confidence level of 78%. Key support is at $15.0 and key resistance at $25.0. Sharp selloff from the $60s into the mid-teens, then a small low-level consolidation; price still far below all major MAs with RSI ~32 (weak/oversold zone).
Base-building attempt in the $15–$20 area (wave-style: likely forming an A-B-C corrective bottom or a Wave 4-type sideways after an extended impulse down), then a rebound to test prior breakdown levels/short-term averages before sellers reappear.
Continuation selloff (final capitulation leg) with an undercut of the recent swing low; bounce attempts stay shallow as overhead MA supply dominates (Fibonacci-wise: typical 0.382/0.5 retraces get sold hard).
State confirmed if weekly closes keep holding below $25 and any bounce fails under $30
Invalidated by 2+ weekly closes back above $25 (first reclaim) followed by a higher low above $18
Start near current base support (~$15) with RSI weak; add on an undercut-and-rally attempt; heavy add only on capitulation flush toward psychological/round-number supports while respecting that trend is still down.
Trim into the first major supply zone ($25–$30) and then into EMA50/EMA100/SMA cluster ($34–$42); fully close if price revisits prior distribution highs ($50–$65) where long-term mean-reversion risk becomes extreme.
As of March 26, 2026, BITX (2X BITCOIN STRATEGY ETF) is in a falling knife state on the weekly chart with 78% confidence. Sharp selloff from the $60s into the mid-teens, then a small low-level consolidation; price still far below all major MAs with RSI ~32 (weak/oversold zone).
On the weekly timeframe, BITX has key support at $15.0 and key resistance at $25.0. The most likely scenario (bullish) targets $20.0 and $25.0, with a revert level at $17.0.
BITX (2X BITCOIN STRATEGY ETF) is currently classified as falling knife on the weekly chart, with 78% confidence. Confirmation requires: State confirmed if weekly closes keep holding below $25 and any bounce fails under $30 This would be invalidated by: Invalidated by 2+ weekly closes back above $25 (first reclaim) followed by a higher low above $18
The most likely scenario (bullish) targets $20.0 and $25.0, with a revert level at $17.0. The alternative scenario (bearish) targets $14.0 and $12.0.
Multi-layer AI agents analyse 200+ stocks across daily, weekly, and monthly timeframes — producing market state classifications, price scenarios with targets, and position entry/exit levels. Updated every trading day after market close. No paywall. No sign-up required.
Built by Foliotrail.
All content on this website — including charts, analysis, price targets, support/resistance levels, and position zones — is generated entirely by AI and provided for educational and informational purposes only.
This is not financial advice. NEXUSNOIR VENTURES SL (the operator of this website) is not a registered investment adviser or broker-dealer. You should not make investment decisions based solely on this information. Always do your own research and consult a qualified financial advisor.
By continuing, you acknowledge that you have read and agree to our full disclaimer & terms of use and privacy policy.