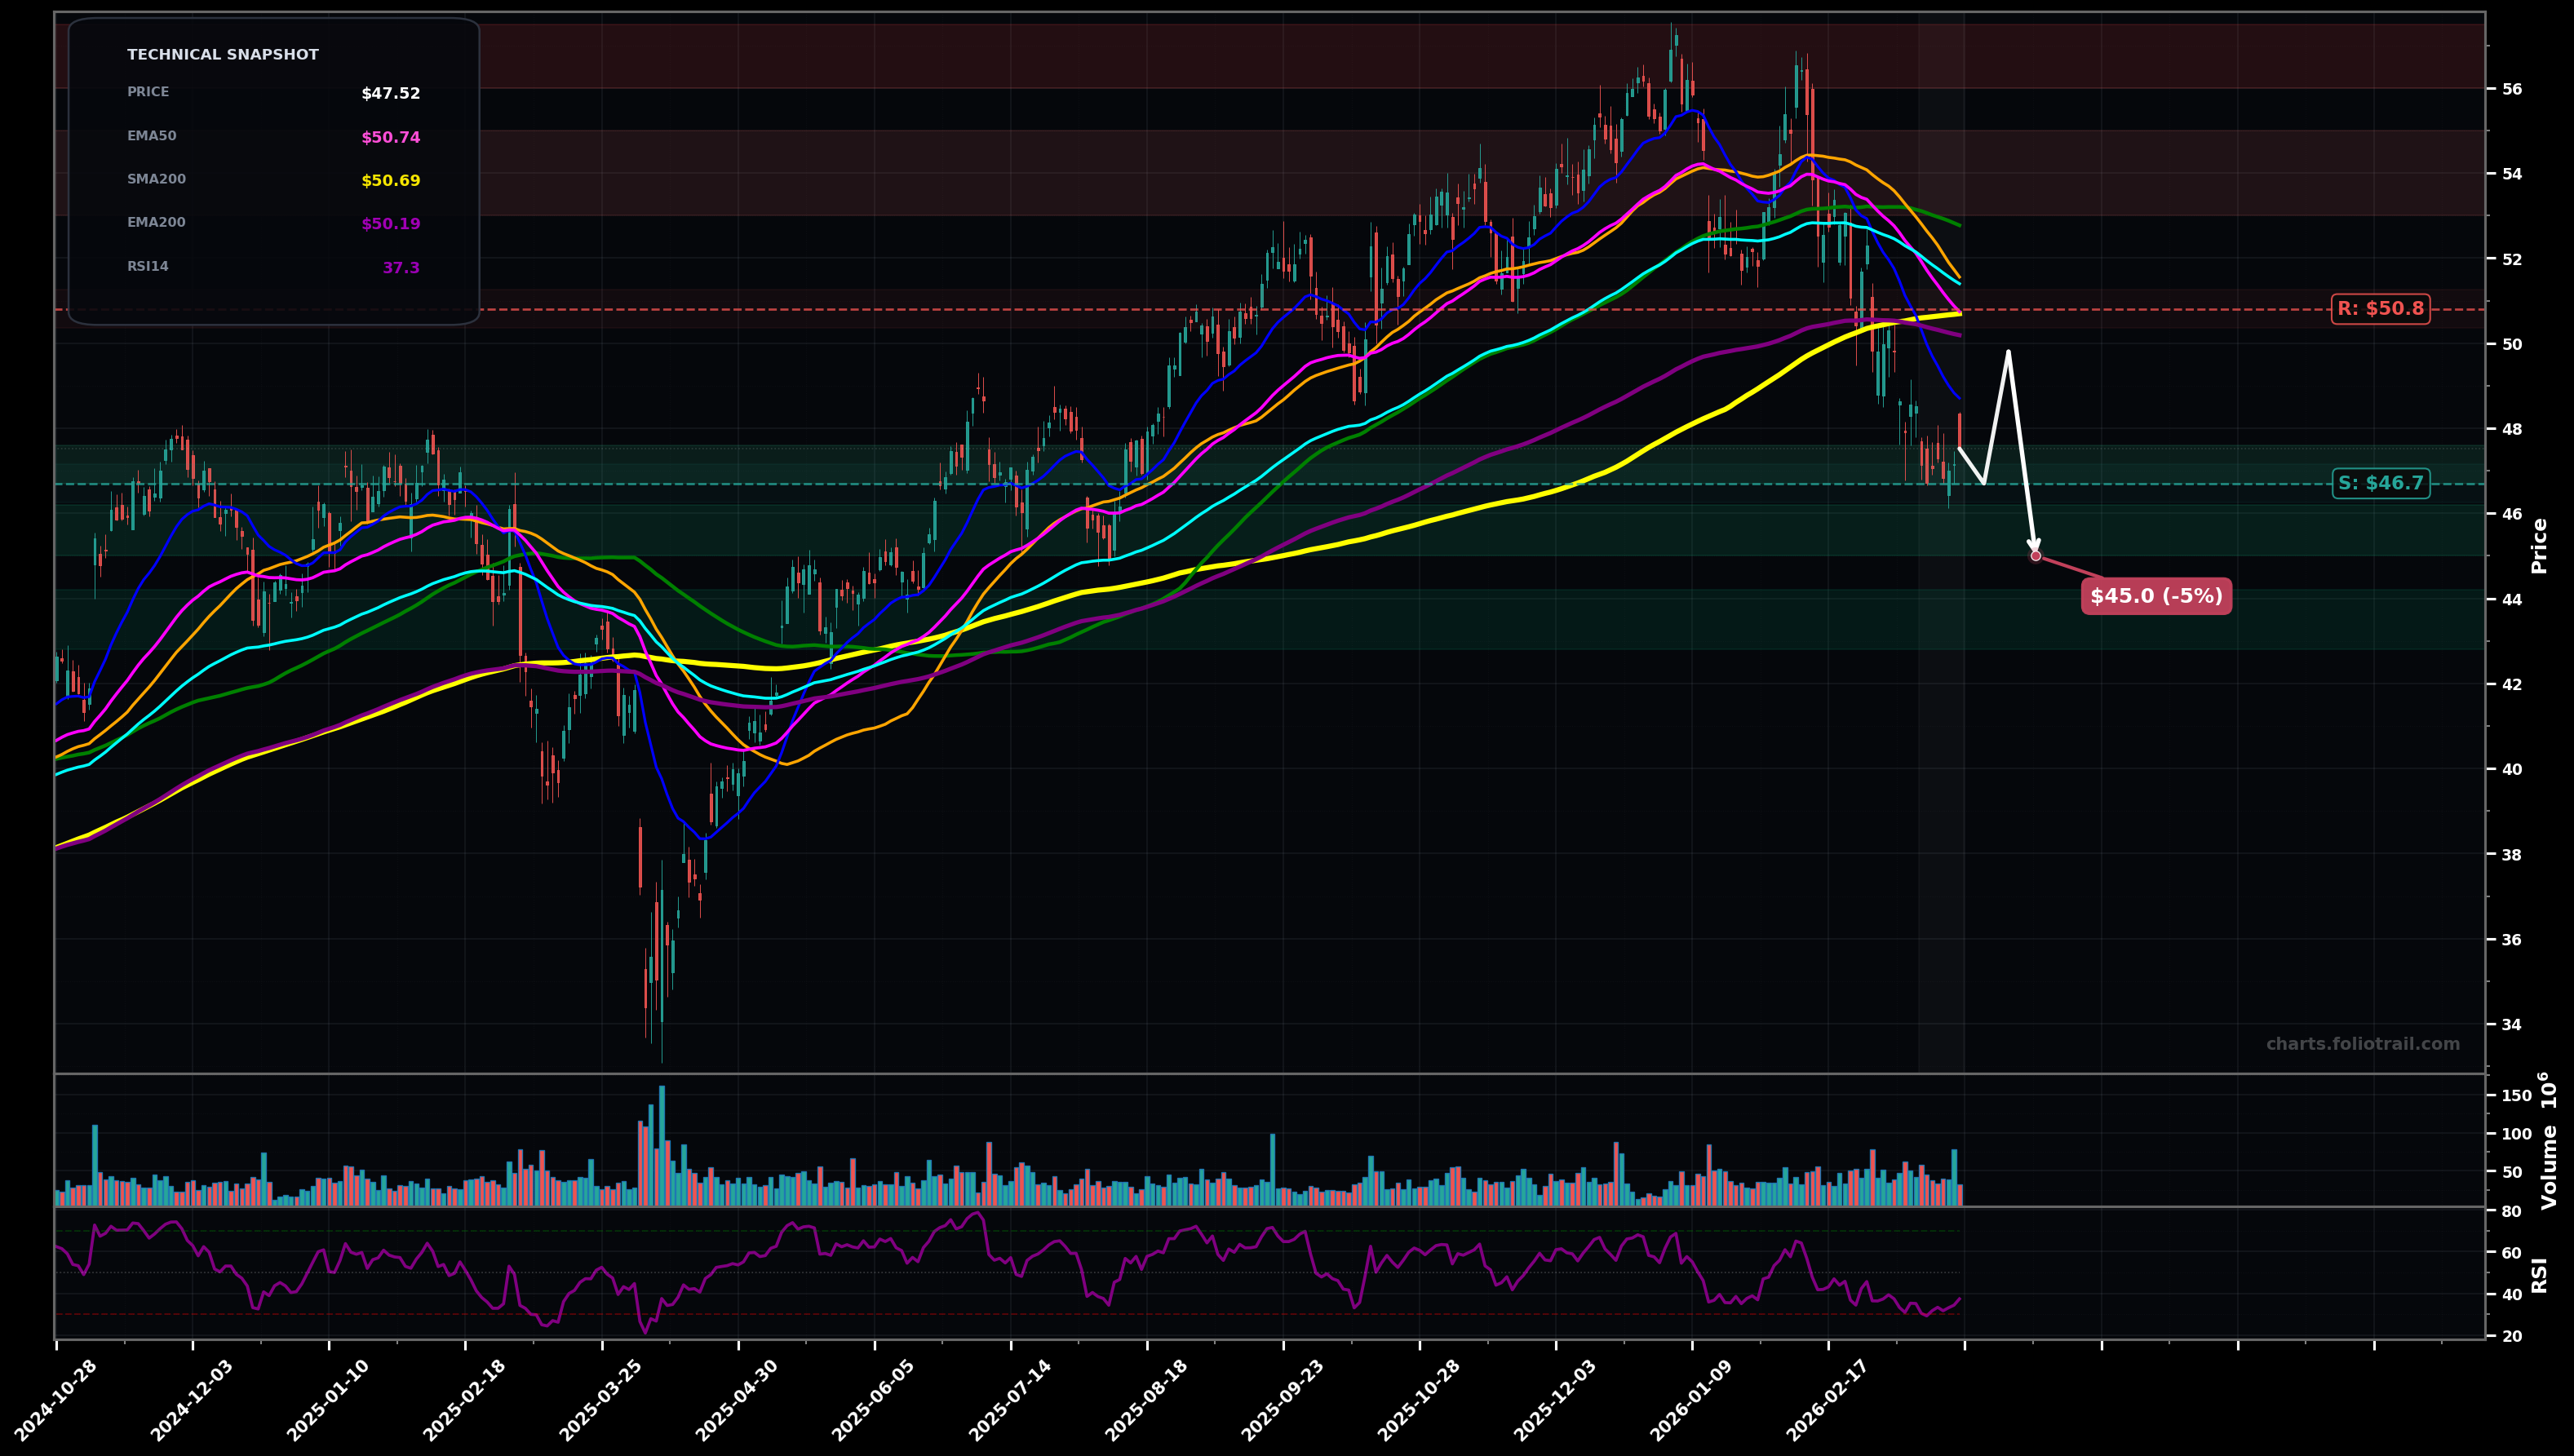
As of March 23, 2026, BAC (Bank of America Corporation) is in a downtrend state on the daily chart, with a confidence level of 72%. Key support is at $46.7 and key resistance at $50.8. Sharp pullback from ~$57 area with LH/LL swings; price ($47.52) now below EMA50/EMA100/EMA200 and all key SMAs; weak bounce attempt with RSI ~37.
Bearish continuation: bounce stalls into the $50.0–$51.0 MA cluster (EMA50/EMA100) then rolls over to retest the $46.7 pivot; if that breaks, sellers target the next demand shelf near mid-$45s. (Elliott: likely Wave C / Wave 3 continuation of the corrective leg off the ~$57 top; Fib: current bounce looks like a typical 38.2–50% retrace into MAs before continuation.)
Bottoming attempt: price holds $46.7, prints a higher low and reclaims $50.8; that would open a larger mean-reversion move back toward the SMA200/EMA200 zone, with a stretch target into the prior breakdown area near $53. (Elliott: corrective ABC completes and a new impulsive leg starts; Fib: reclaim of ~61.8% of the last down-swing typically needed to shift structure.)
Daily close below $46.70 (recent swing low reference) would confirm trend continuation
Two daily closes back above $50.75 (EMA50) would invalidate the active downtrend bias
Start near the $46.7 swing-low support; add on a controlled flush to ~$45 demand; heavy add only if a deeper mean-reversion to the prior base/round-number support ~$43–$44 occurs (risk-managed because trend is down).
Trim into the first major overhead supply/MA reclaim zone ($53–$55), trim harder near the prior top ($56–$57.5), and close if price becomes materially stretched above the prior cycle high into $59–$62.
As of March 23, 2026, BAC (Bank of America Corporation) is in a downtrend state on the daily chart with 72% confidence. Sharp pullback from ~$57 area with LH/LL swings; price ($47.52) now below EMA50/EMA100/EMA200 and all key SMAs; weak bounce attempt with RSI ~37.
On the daily timeframe, BAC has key support at $46.7 and key resistance at $50.8. The most likely scenario (bearish) targets $46.7 and $45.0, with a revert level at $49.8.
BAC (Bank of America Corporation) is currently classified as downtrend on the daily chart, with 72% confidence. Confirmation requires: Daily close below $46.70 (recent swing low reference) would confirm trend continuation This would be invalidated by: Two daily closes back above $50.75 (EMA50) would invalidate the active downtrend bias
The most likely scenario (bearish) targets $46.7 and $45.0, with a revert level at $49.8. The alternative scenario (bullish) targets $50.8 and $53.0.
All content on this website — including charts, analysis, price targets, support/resistance levels, and position zones — is generated entirely by AI and provided for educational and informational purposes only.
This is not financial advice. NEXUSNOIR VENTURES SL (the operator of this website) is not a registered investment adviser or broker-dealer. You should not make investment decisions based solely on this information. Always do your own research and consult a qualified financial advisor.
By continuing, you acknowledge that you have read and agree to our full disclaimer & terms of use and privacy policy.