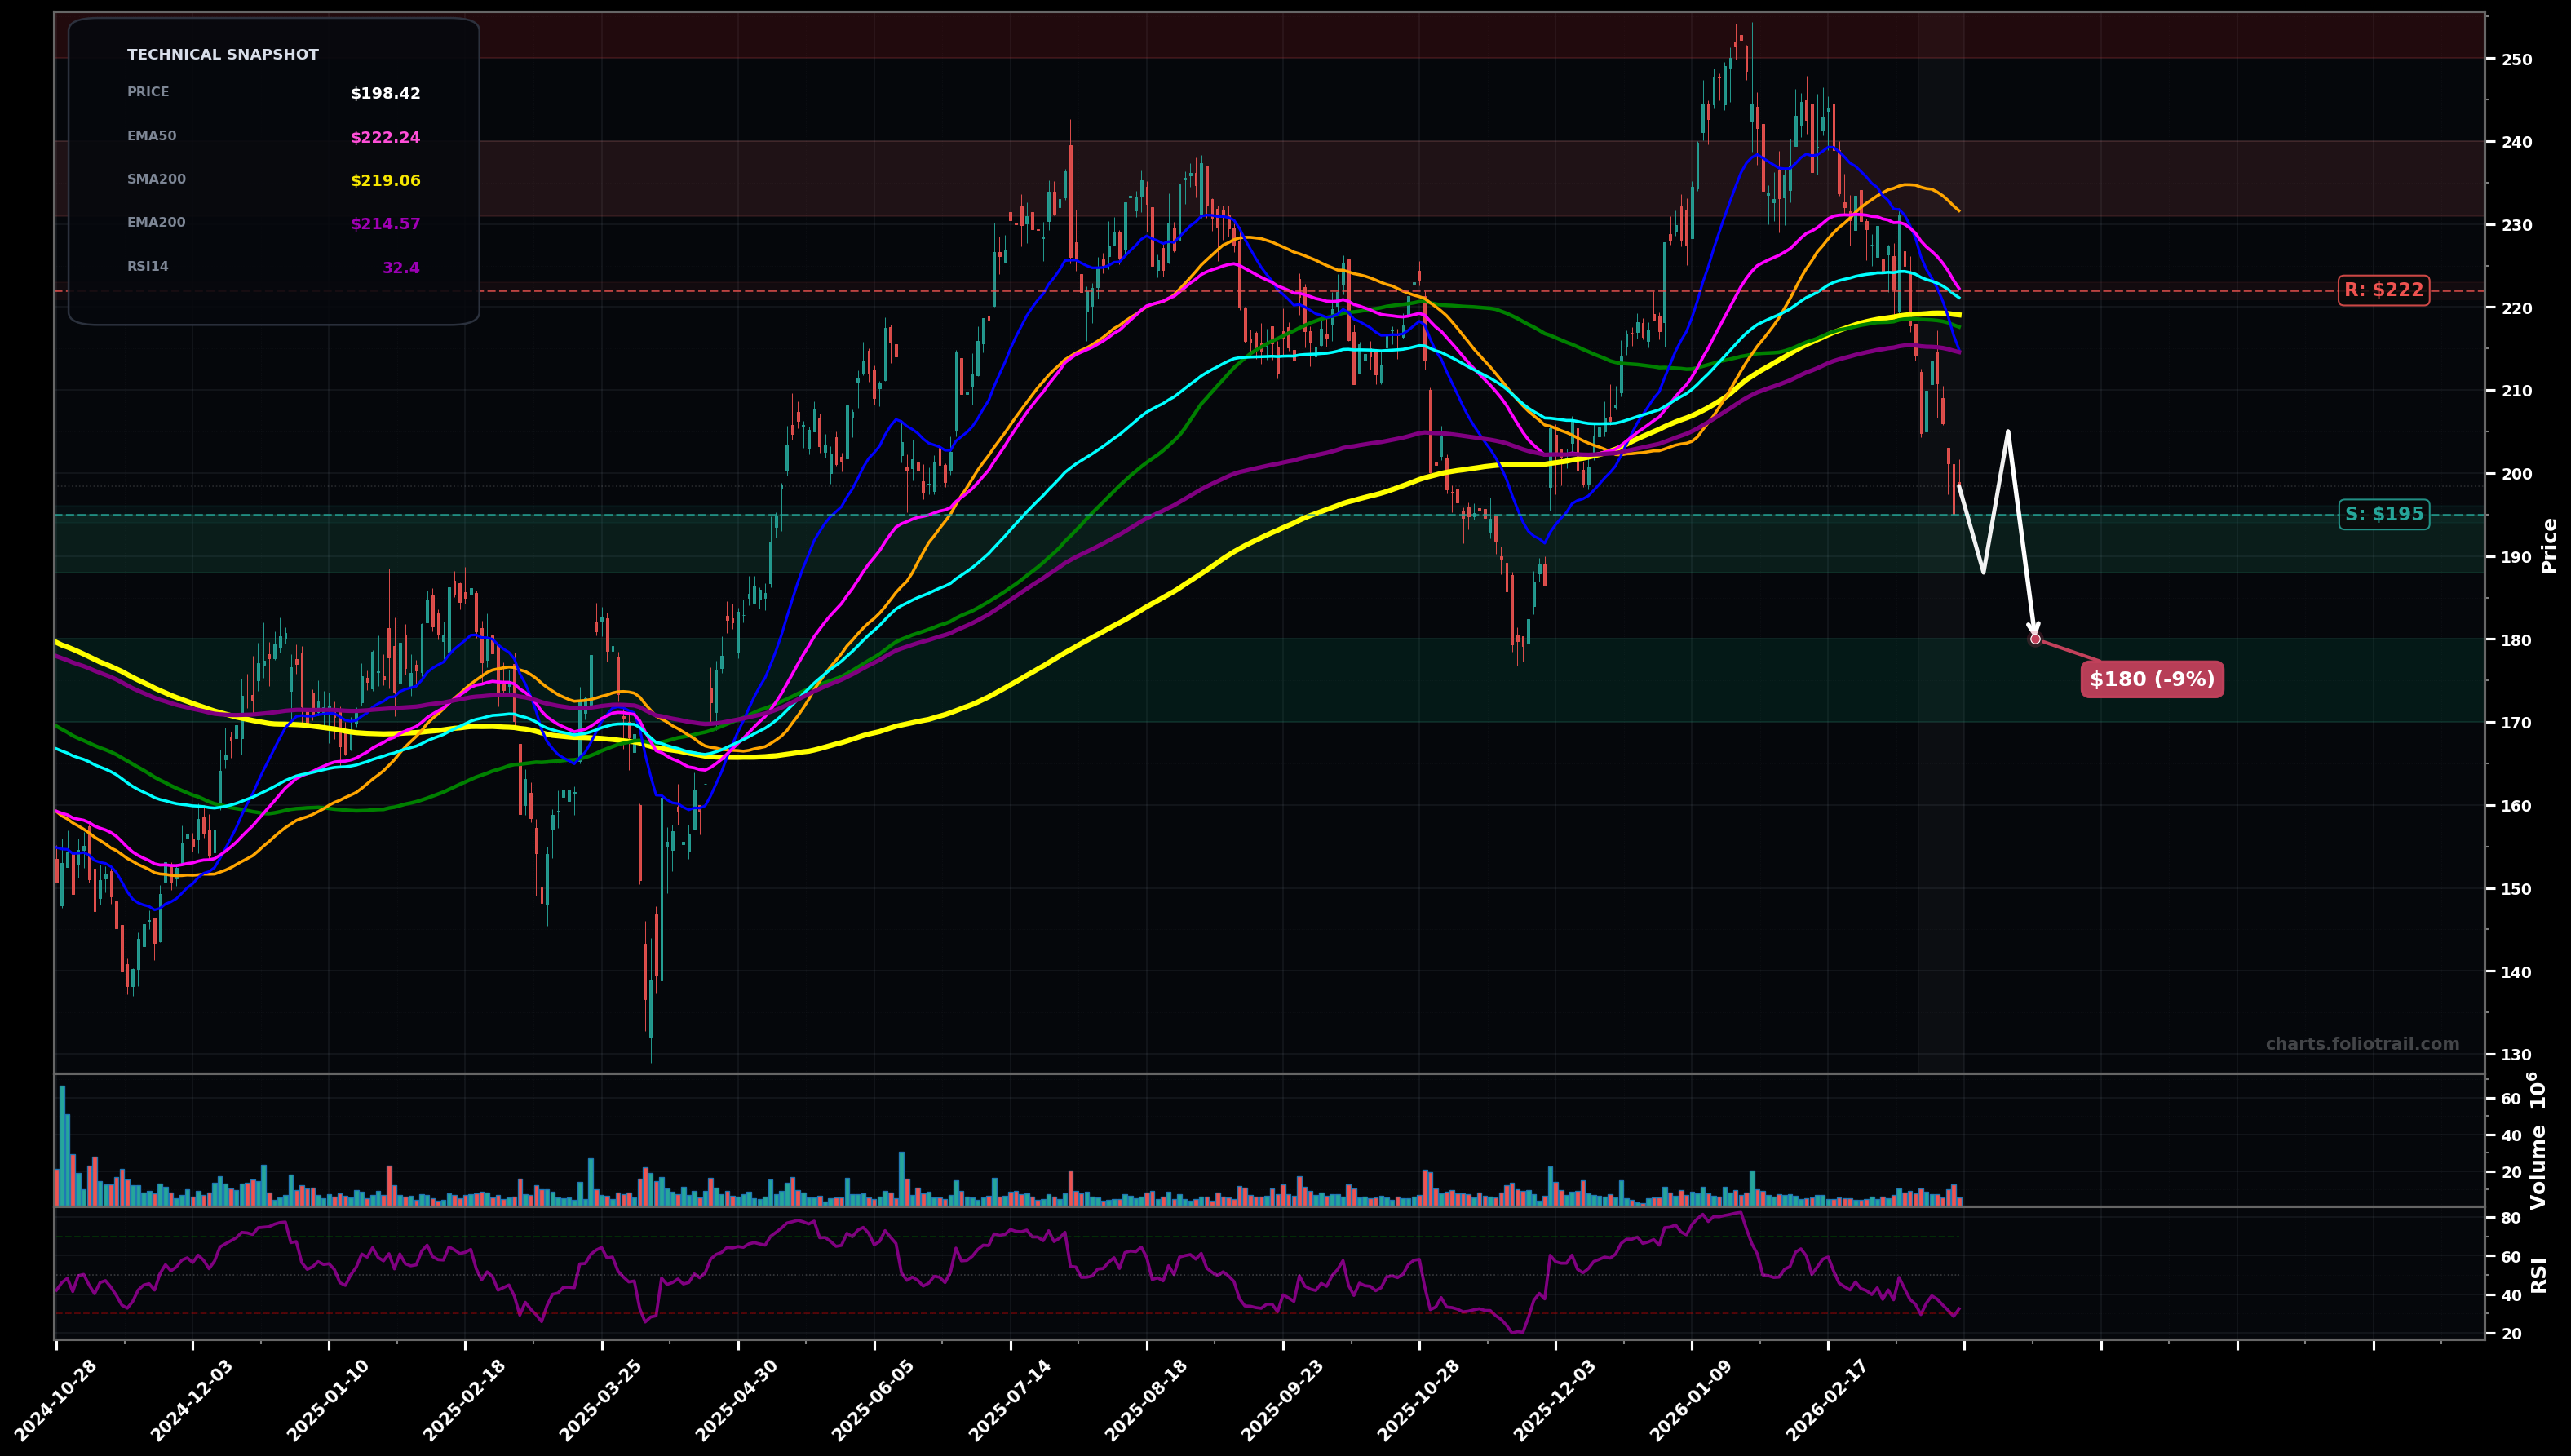
As of March 23, 2026, BA (Boeing Company) is in a downtrend state on the daily chart, with a confidence level of 74%. Key support is at $195 and key resistance at $222. Sharp selloff to ~$198 with price below EMA50/EMA100 and under SMA200; RSI ~32 (weak/near-oversold) after multiple lower highs.
Bearish continuation: price chops briefly then breaks $195, seeking the next demand zone near the prior pivot/MA shelf (~$188-$180). (Elliott: likely in a Wave 3/5 down of the correction from ~$250; Fib: targeting the 61.8%-78.6% retrace of the Nov–Jan advance zone.)
Mean-reversion bounce: holds $195 and forms a swing low/high, then reclaims EMA50 (~$222) for a corrective rally into the MA cluster and prior breakdown area. (Elliott: Wave B/2 style bounce before another test of lows; Fib: retrace toward 38.2%-50% of the last downswing.)
Daily close below $195 would confirm continued downtrend pressure toward the next support band.
Two consecutive daily closes back above $222 (EMA50) would invalidate the immediate downtrend impulse and shift to reversal/base risk.
Scale in at the nearest swing-low support (~$195) then prior pivot shelf (~$188/$180); heavy add only if a capitulation flush pushes into the next multi-month base area.
Trim into the MA/structure overhead supply first (~$231-$240), more aggressively into the prior top zone (~$240-$250), and exit if price becomes stretched back above the former peak/extension area (~$250+).
As of March 23, 2026, BA (Boeing Company) is in a downtrend state on the daily chart with 74% confidence. Sharp selloff to ~$198 with price below EMA50/EMA100 and under SMA200; RSI ~32 (weak/near-oversold) after multiple lower highs.
On the daily timeframe, BA has key support at $195 and key resistance at $222. The most likely scenario (bearish) targets $188 and $180, with a revert level at $205.
BA (Boeing Company) is currently classified as downtrend on the daily chart, with 74% confidence. Confirmation requires: Daily close below $195 would confirm continued downtrend pressure toward the next support band. This would be invalidated by: Two consecutive daily closes back above $222 (EMA50) would invalidate the immediate downtrend impulse and shift to reversal/base risk.
The most likely scenario (bearish) targets $188 and $180, with a revert level at $205. The alternative scenario (bullish) targets $214 and $231.
All content on this website — including charts, analysis, price targets, support/resistance levels, and position zones — is generated entirely by AI and provided for educational and informational purposes only.
This is not financial advice. NEXUSNOIR VENTURES SL (the operator of this website) is not a registered investment adviser or broker-dealer. You should not make investment decisions based solely on this information. Always do your own research and consult a qualified financial advisor.
By continuing, you acknowledge that you have read and agree to our full disclaimer & terms of use and privacy policy.