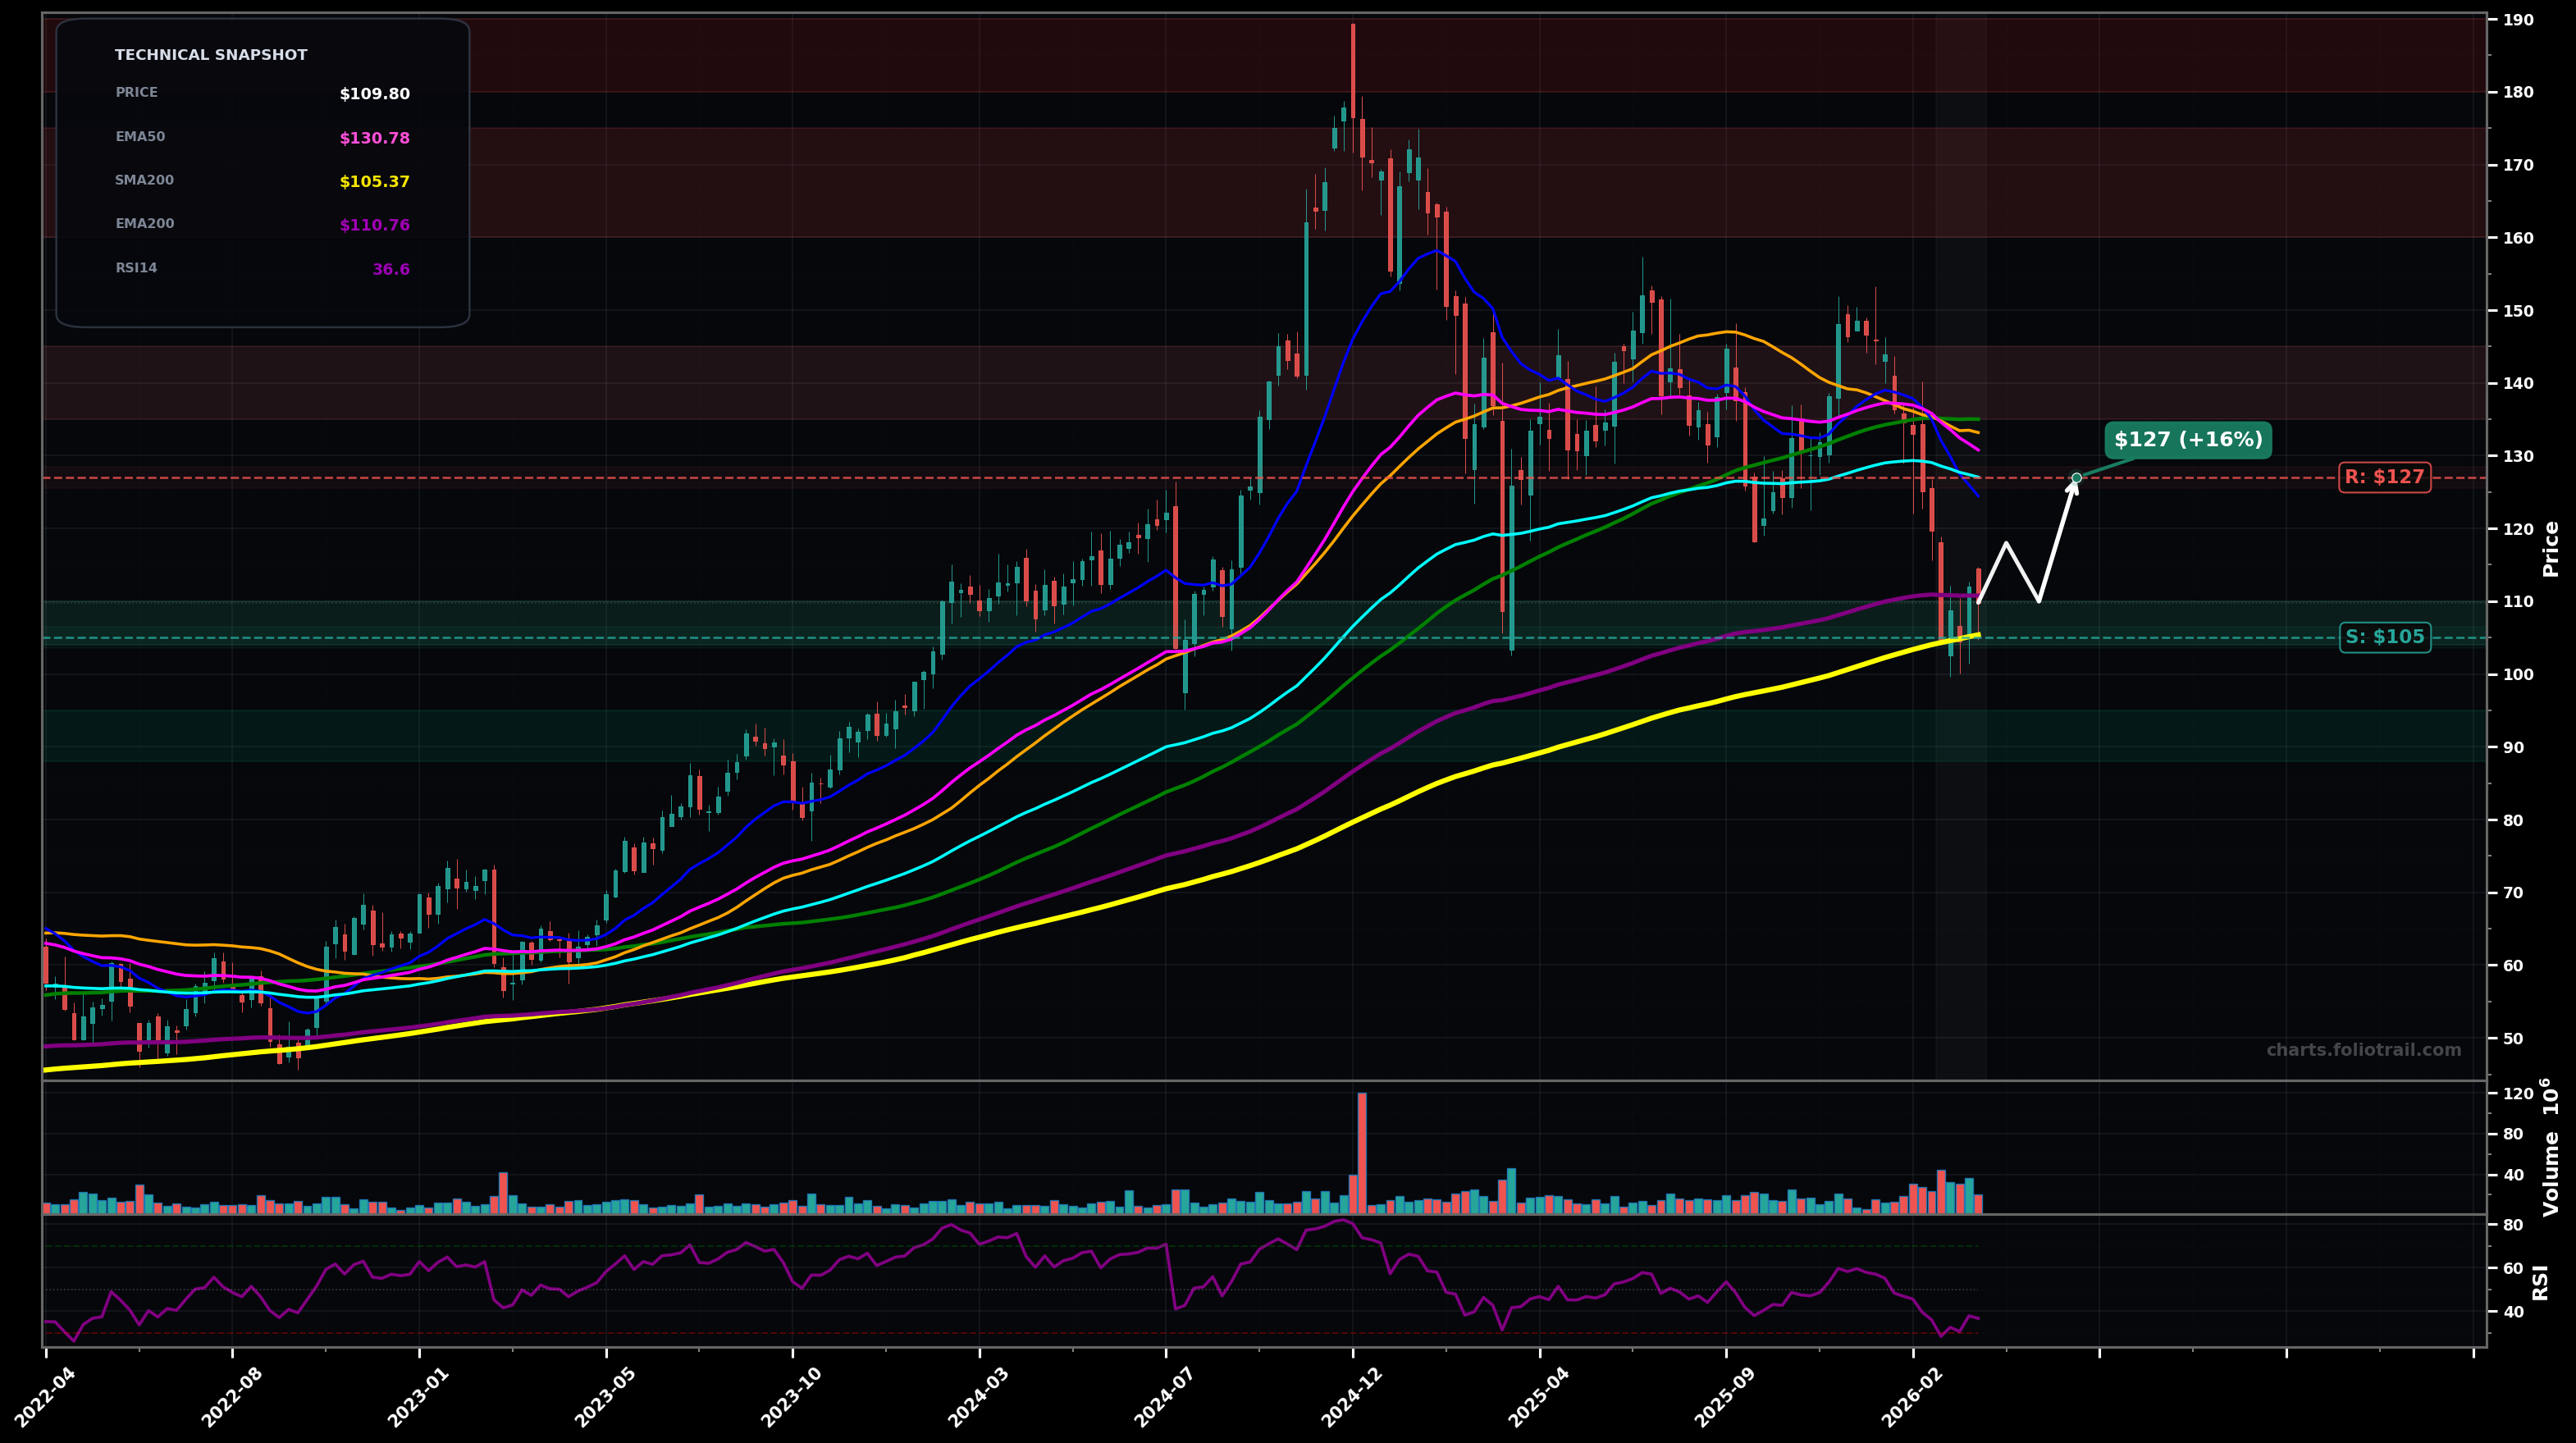
As of March 26, 2026, APO (Apollo Global Management, Inc.) is in a downtrend state on the weekly chart, with a confidence level of 72%. Key support is at $105 and key resistance at $127. Weekly selloff broke below EMA50/EMA100 and sliced through the $120-$125 area; price is now sitting just above the rising SMA200/EMA200 cluster near $105-$111 with RSI ~36 (weak momentum).
Support holds at the SMA200/EMA200 zone and price mean-reverts into the broken MA band; base attempts to form before a larger decision.
SMA200 fails on a weekly close; downside accelerates (Wave C / capitulation-style leg) toward prior demand from 2023-2024.
Weekly close below $105 would confirm a deeper breakdown (loss of SMA200 support).
Weekly close back above $127 would invalidate the current downtrend structure (reclaim EMA100 area).
Start near confluence of SMA200/EMA200 + prior pivot demand; add on confirmed breakdown/flush into next demand; heavy add only if capitulation to lower weekly support with RSI depressed.
Trim into former supply/MA band ($135-$145) then into prior swing distribution ($160-$175); close into retest of the prior cycle high zone (~$180-$190) where risk of major rejection is elevated.
As of March 26, 2026, APO (Apollo Global Management, Inc.) is in a downtrend state on the weekly chart with 72% confidence. Weekly selloff broke below EMA50/EMA100 and sliced through the $120-$125 area; price is now sitting just above the rising SMA200/EMA200 cluster near $105-$111 with RSI ~36 (weak momentum).
On the weekly timeframe, APO has key support at $105 and key resistance at $127. The most likely scenario (bullish) targets $118 and $127, with a revert level at $110.
APO (Apollo Global Management, Inc.) is currently classified as downtrend on the weekly chart, with 72% confidence. Confirmation requires: Weekly close below $105 would confirm a deeper breakdown (loss of SMA200 support). This would be invalidated by: Weekly close back above $127 would invalidate the current downtrend structure (reclaim EMA100 area).
The most likely scenario (bullish) targets $118 and $127, with a revert level at $110. The alternative scenario (bearish) targets $98.0 and $90.0.
Multi-layer AI agents analyse 200+ stocks across daily, weekly, and monthly timeframes — producing market state classifications, price scenarios with targets, and position entry/exit levels. Updated every trading day after market close. No paywall. No sign-up required.
Built by Foliotrail.
All content on this website — including charts, analysis, price targets, support/resistance levels, and position zones — is generated entirely by AI and provided for educational and informational purposes only.
This is not financial advice. NEXUSNOIR VENTURES SL (the operator of this website) is not a registered investment adviser or broker-dealer. You should not make investment decisions based solely on this information. Always do your own research and consult a qualified financial advisor.
By continuing, you acknowledge that you have read and agree to our full disclaimer & terms of use and privacy policy.