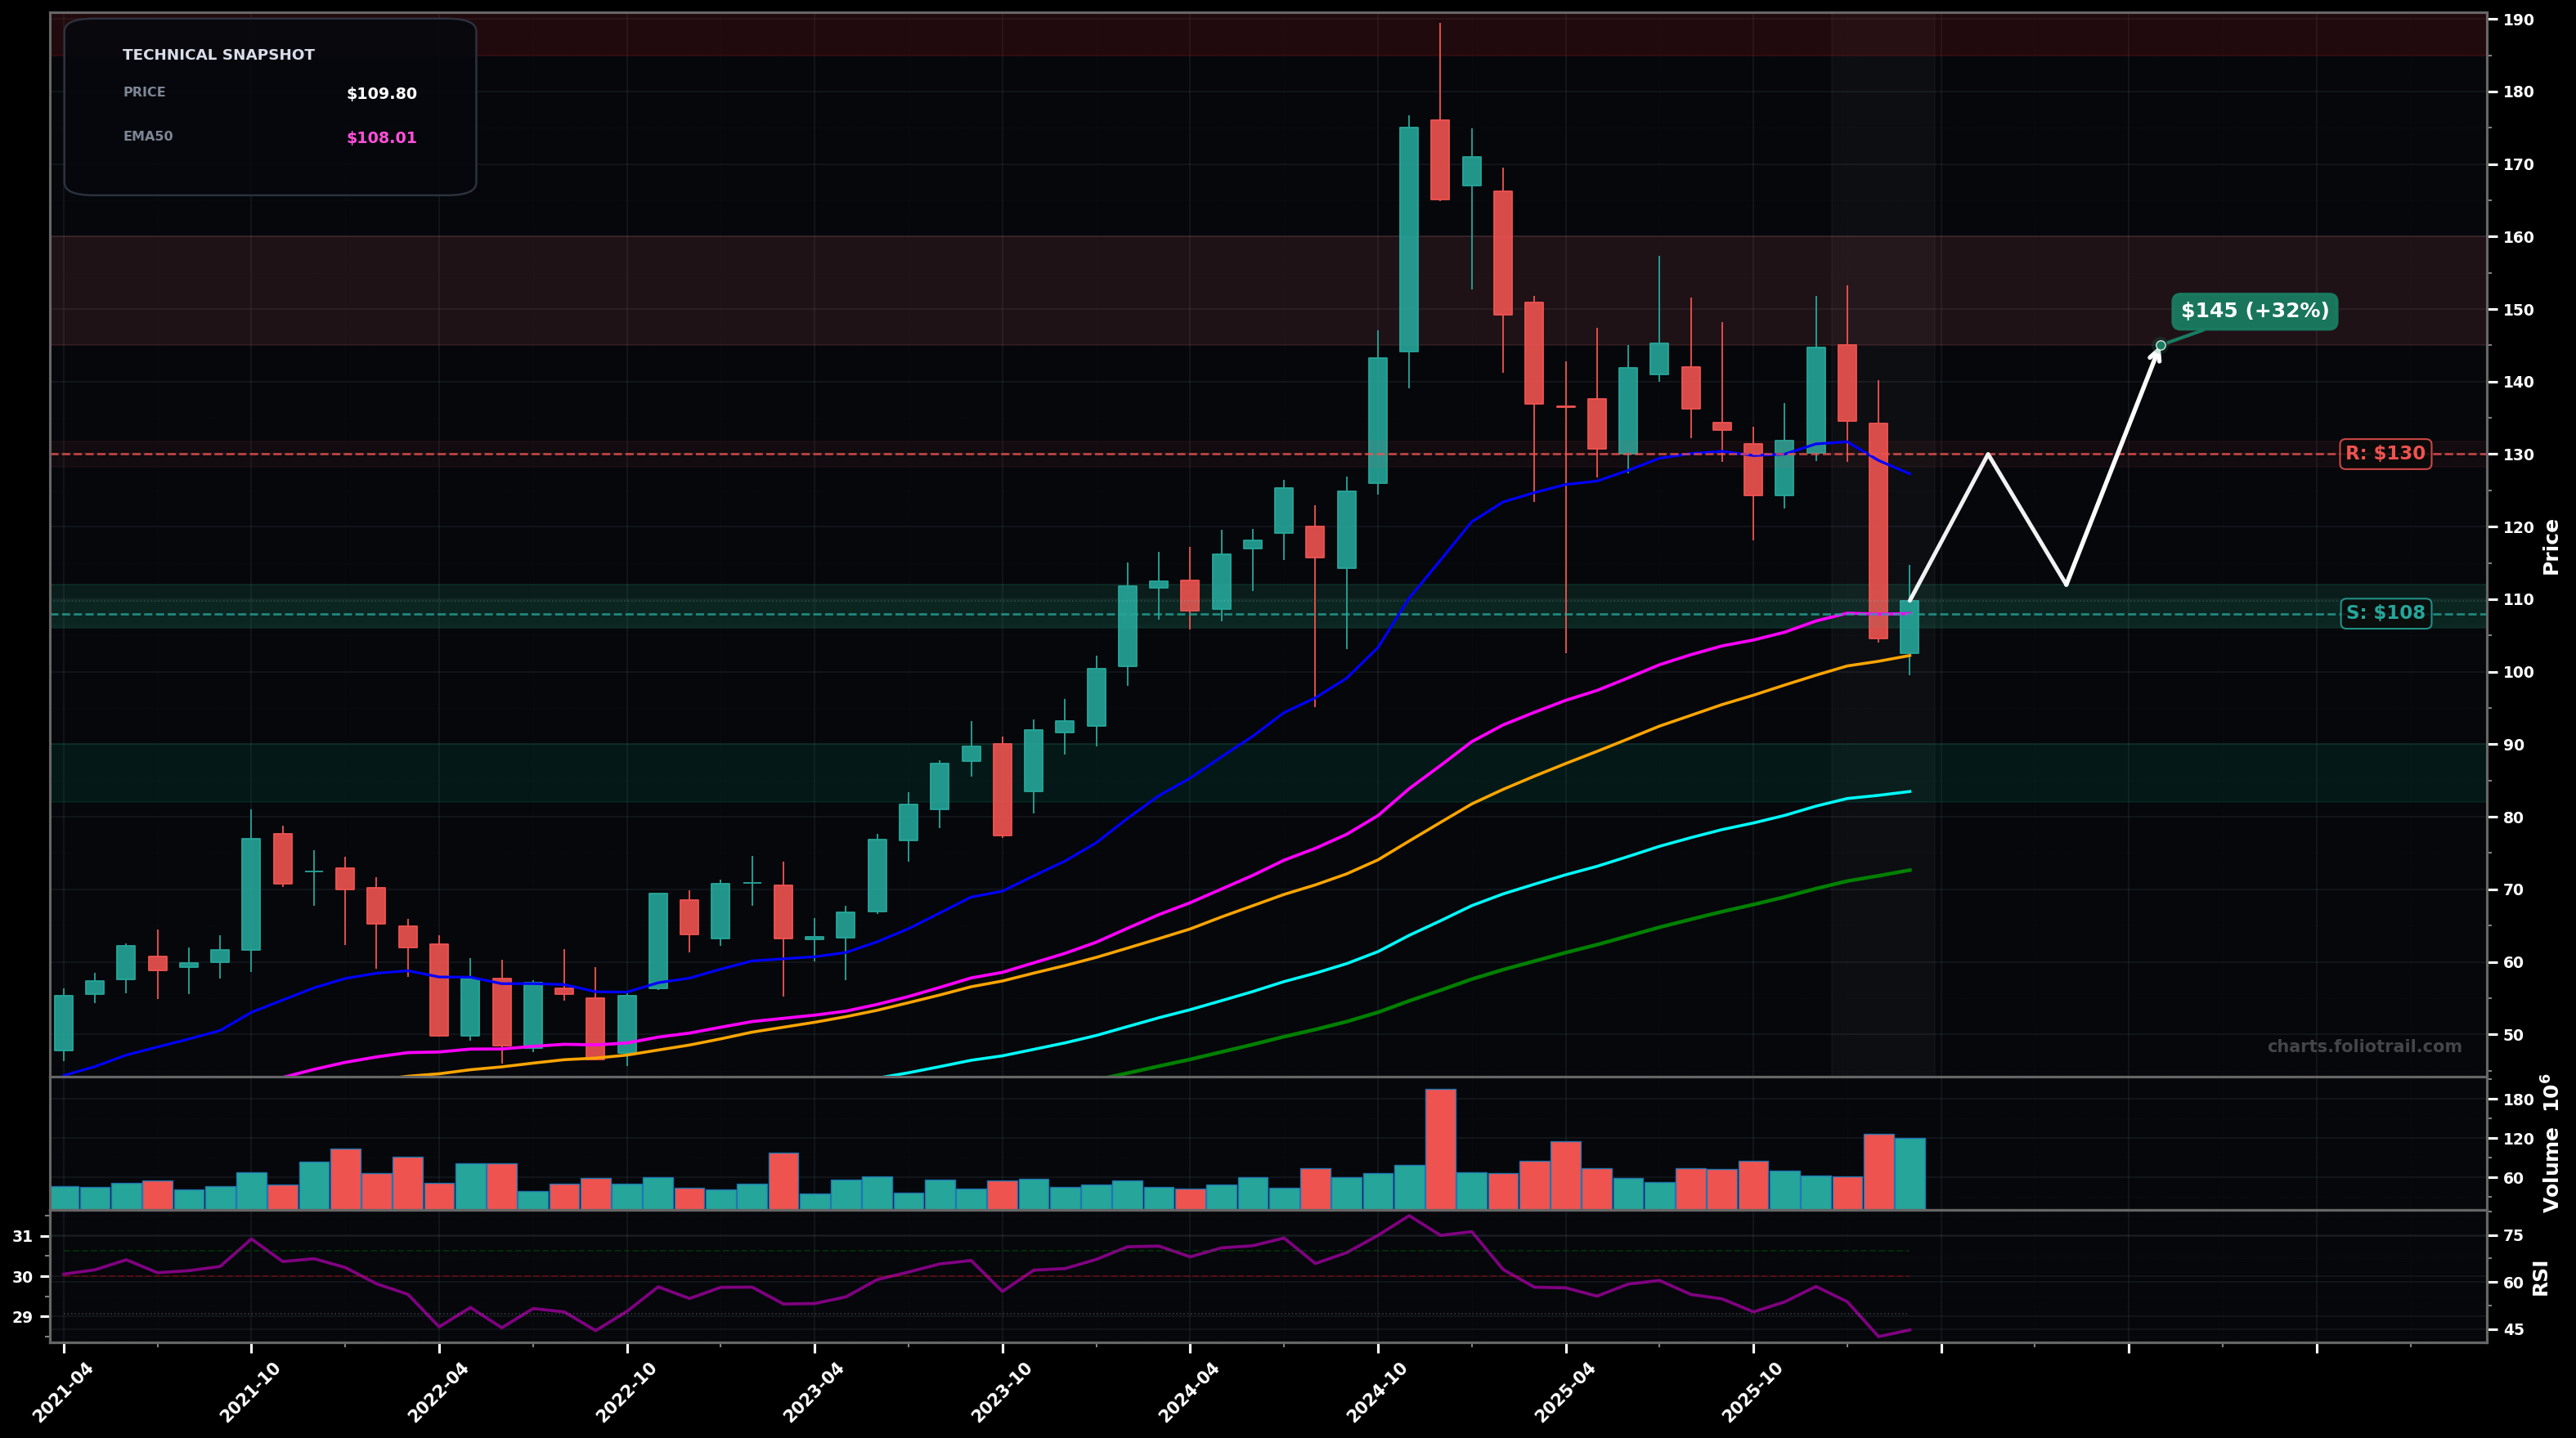
As of March 26, 2026, APO (Apollo Global Management, Inc.) is in a bottoming attempt state on the monthly chart, with a confidence level of 58%. Key support is at $108 and key resistance at $130. Monthly selloff from the $140s-$150s into a sharp drop toward the rising EMA50/SMA50 area, then a small bounce; momentum weakened (RSI mid-$40s).
Base-building/sideways chop between ~$105-$130, then a recovery leg that reclaims the prior breakdown zone; Elliott view: corrective wave (4)/(B) forming before the next impulsive attempt higher; Fib retrace focus is reclaiming the ~38.2%-50% of the last downswing (roughly $130-$145).
Support fails and the correction extends (Elliott: wave (C) / wave 5 down in the correction), with price losing the EMA50/SMA50 area and sliding toward the next higher-timeframe mean (EMA100) and prior consolidation demand.
2 monthly closes back above $120
Monthly close below $102
Start near current MA-cluster support (~EMA50/SMA50), add on a clean break/flush to the next psychological/structure level ($100 area), heavy add only at EMA100/older base demand ($80s) if capitulation occurs.
Trim into Fib retrace/overhead supply from the breakdown ($145-$160), trim more near the prior distribution zone ($170-$180), and fully close into/above the prior peak area ($185-$200) where long-term upside becomes most stretched.
As of March 26, 2026, APO (Apollo Global Management, Inc.) is in a bottoming attempt state on the monthly chart with 58% confidence. Monthly selloff from the $140s-$150s into a sharp drop toward the rising EMA50/SMA50 area, then a small bounce; momentum weakened (RSI mid-$40s).
On the monthly timeframe, APO has key support at $108 and key resistance at $130. The most likely scenario (bullish) targets $130 and $145, with a revert level at $112.
APO (Apollo Global Management, Inc.) is currently classified as bottoming attempt on the monthly chart, with 58% confidence. Confirmation requires: 2 monthly closes back above $120 This would be invalidated by: Monthly close below $102
The most likely scenario (bullish) targets $130 and $145, with a revert level at $112. The alternative scenario (bearish) targets $100 and $84.0.
Multi-layer AI agents analyse 200+ stocks across daily, weekly, and monthly timeframes — producing market state classifications, price scenarios with targets, and position entry/exit levels. Updated every trading day after market close. No paywall. No sign-up required.
Built by Foliotrail.
All content on this website — including charts, analysis, price targets, support/resistance levels, and position zones — is generated entirely by AI and provided for educational and informational purposes only.
This is not financial advice. NEXUSNOIR VENTURES SL (the operator of this website) is not a registered investment adviser or broker-dealer. You should not make investment decisions based solely on this information. Always do your own research and consult a qualified financial advisor.
By continuing, you acknowledge that you have read and agree to our full disclaimer & terms of use and privacy policy.