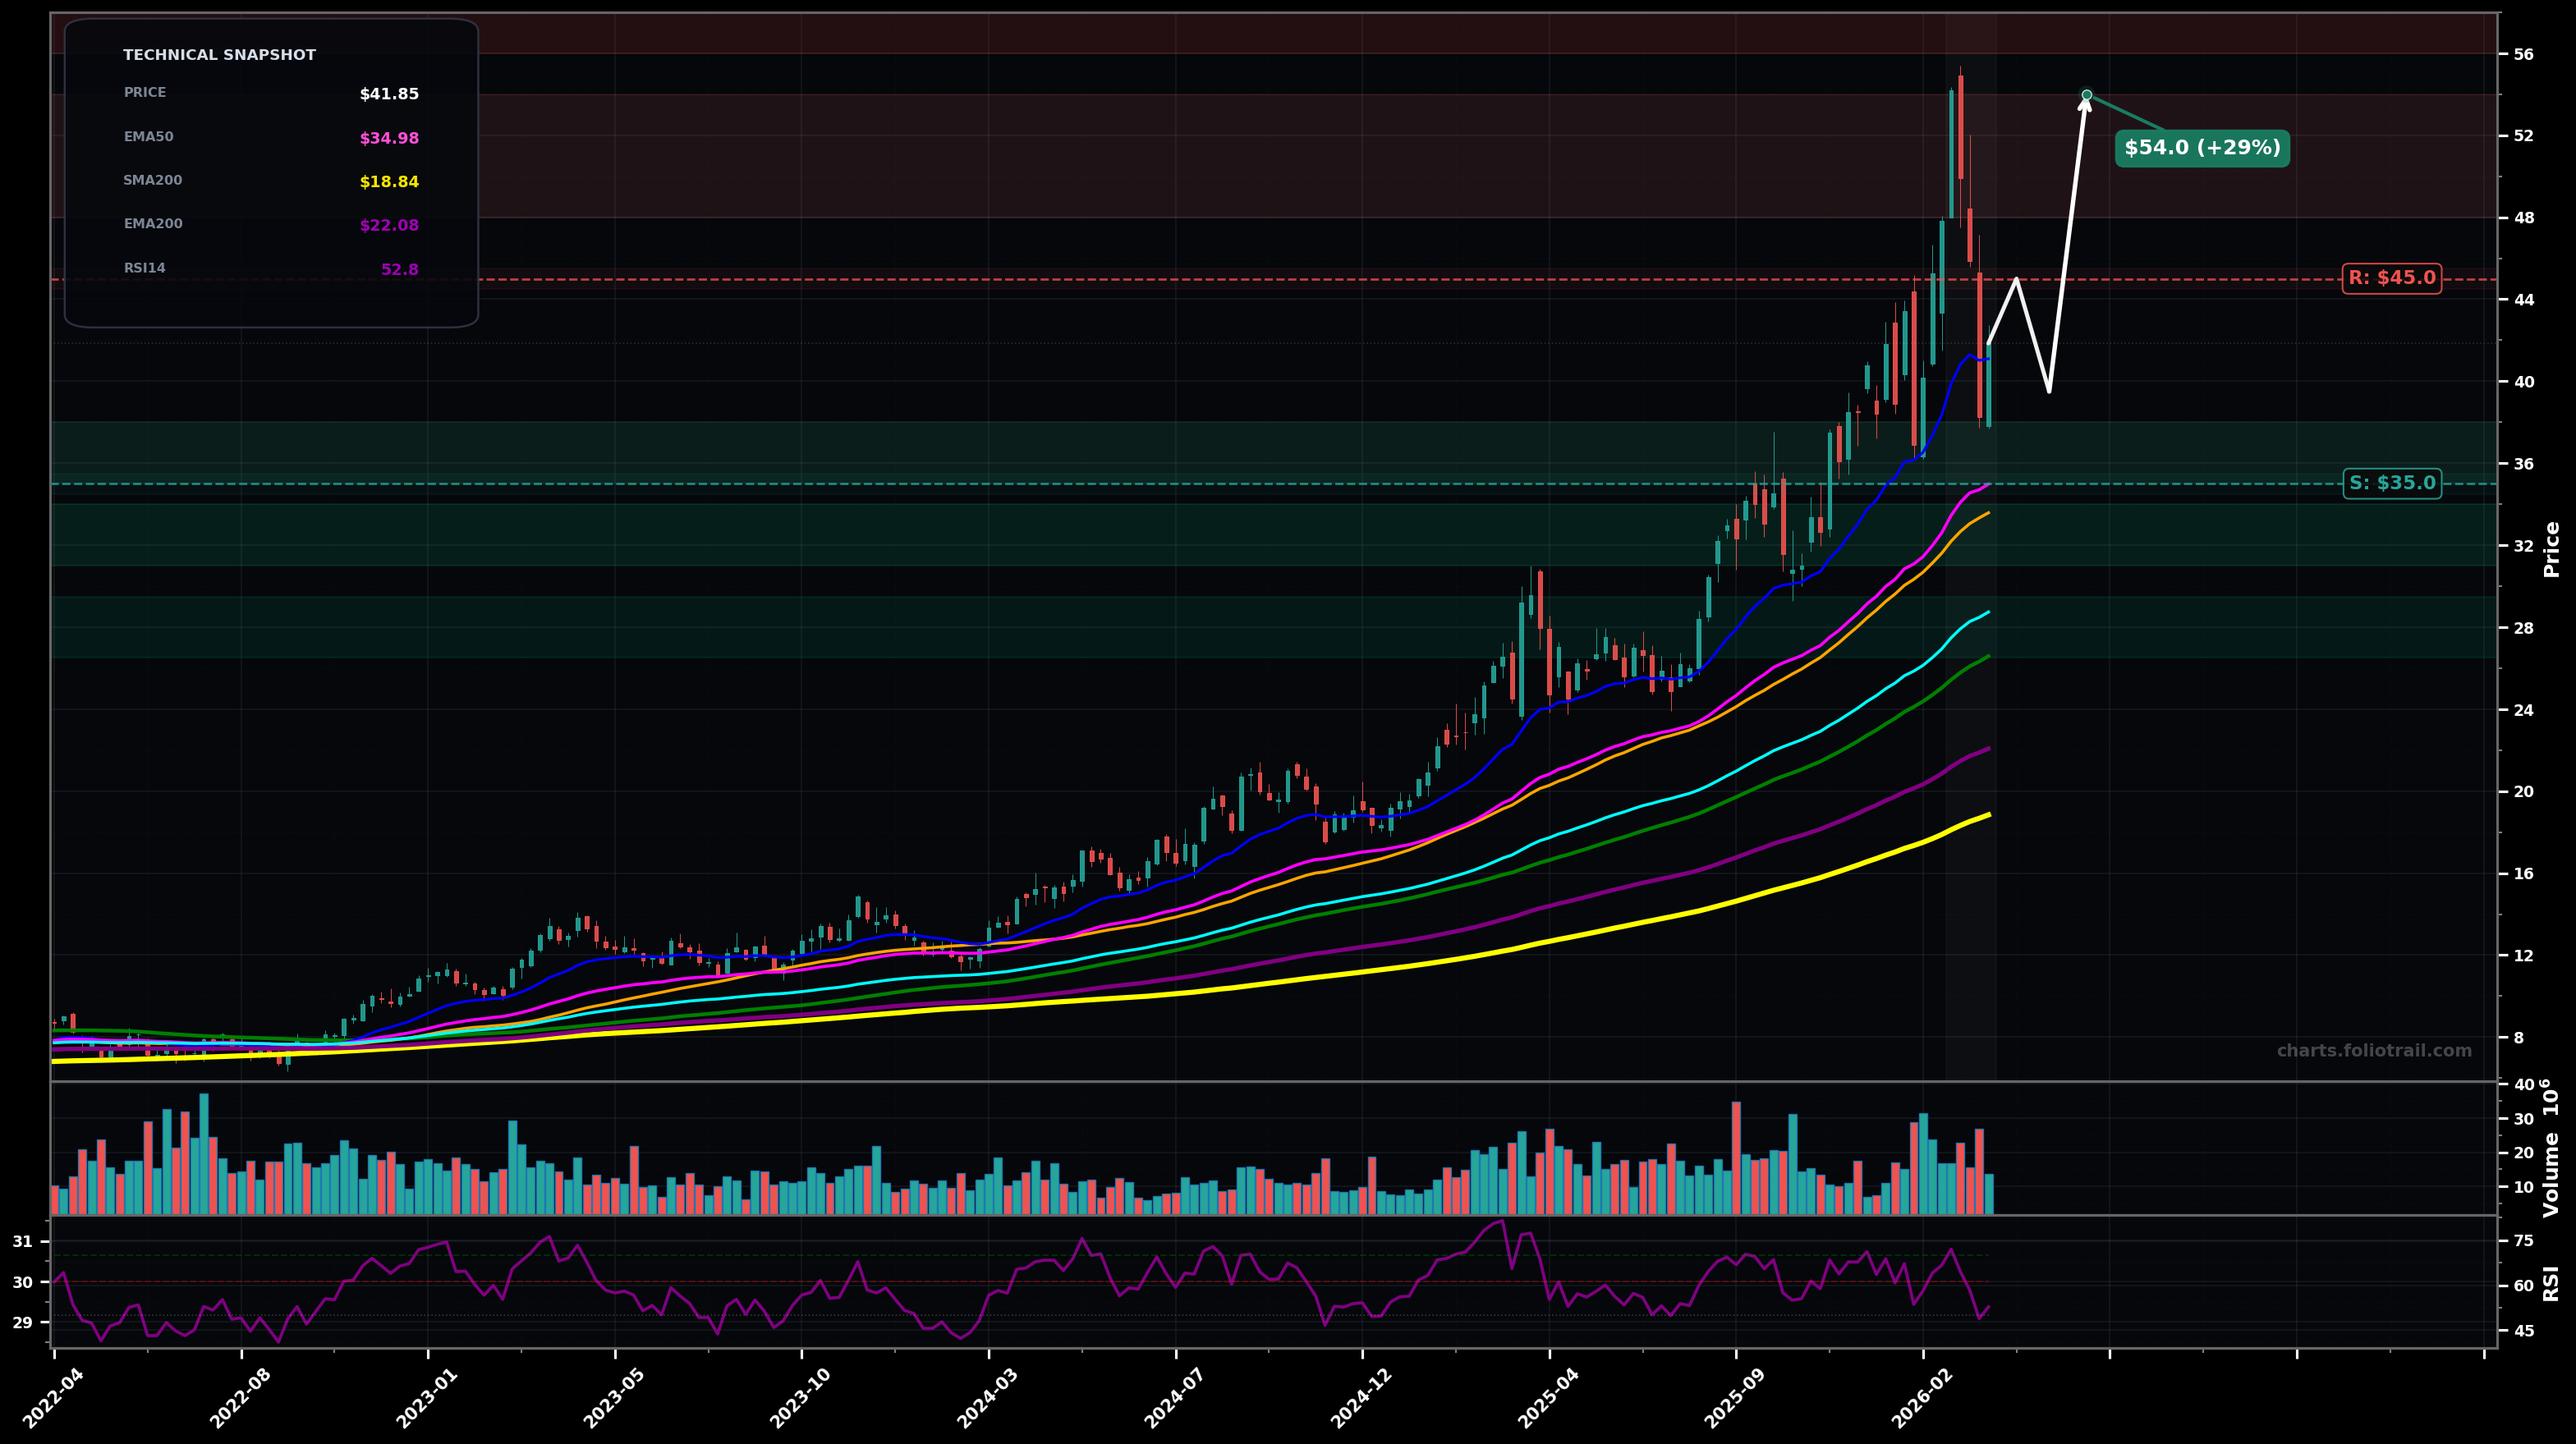
As of March 26, 2026, AGI (Alamos Gold Inc.) is in a volatility expansion state on the weekly chart, with a confidence level of 67%. Key support is at $35.0 and key resistance at $45.0. After a sharp run to ~$54, AGI pulled back fast to ~$40s and is trying to stabilize above the rising EMA50 while RSI reset to ~53.
Bullish continuation: pullback holds above EMA50 and forms a HL, then grinds back toward the prior breakout zone and retests the spike high (wave 4 -> wave 5 attempt). Rough probability ~60%.
Deeper corrective unwind: price loses EMA50 and mean-reverts toward the EMA100/SMA100 confluence as a larger A-B-C correction after the blow-off top. Rough probability ~40%.
Weekly close above $45.00 (and holding for 2+ weeks) would confirm bull control after the pullback
Weekly close below $34.50 would invalidate the post-spike stabilization and raise odds of a deeper unwind
Start near the EMA50/support shelf (~$35); add into EMA100/SMA100 area (~$29-$34); heavy add near deeper mean-reversion zone around EMA100 and prior structure ($26.5-$29.5).
Trim into prior spike supply ($48-$54), increase trimming on a fresh extension beyond the old high ($56-$64), and close into a further blow-off extension where wave-5 risk is highest ($65-$75).
As of March 26, 2026, AGI (Alamos Gold Inc.) is in a volatility expansion state on the weekly chart with 67% confidence. After a sharp run to ~$54, AGI pulled back fast to ~$40s and is trying to stabilize above the rising EMA50 while RSI reset to ~53.
On the weekly timeframe, AGI has key support at $35.0 and key resistance at $45.0. The most likely scenario (bullish) targets $45.0 and $54.0, with a revert level at $39.5.
AGI (Alamos Gold Inc.) is currently classified as volatility expansion on the weekly chart, with 67% confidence. Confirmation requires: Weekly close above $45.00 (and holding for 2+ weeks) would confirm bull control after the pullback This would be invalidated by: Weekly close below $34.50 would invalidate the post-spike stabilization and raise odds of a deeper unwind
The most likely scenario (bullish) targets $45.0 and $54.0, with a revert level at $39.5. The alternative scenario (bearish) targets $34.0 and $29.0.
Multi-layer AI agents analyse 200+ stocks across daily, weekly, and monthly timeframes — producing market state classifications, price scenarios with targets, and position entry/exit levels. Updated every trading day after market close. No paywall. No sign-up required.
Built by Foliotrail.
All content on this website — including charts, analysis, price targets, support/resistance levels, and position zones — is generated entirely by AI and provided for educational and informational purposes only.
This is not financial advice. NEXUSNOIR VENTURES SL (the operator of this website) is not a registered investment adviser or broker-dealer. You should not make investment decisions based solely on this information. Always do your own research and consult a qualified financial advisor.
By continuing, you acknowledge that you have read and agree to our full disclaimer & terms of use and privacy policy.