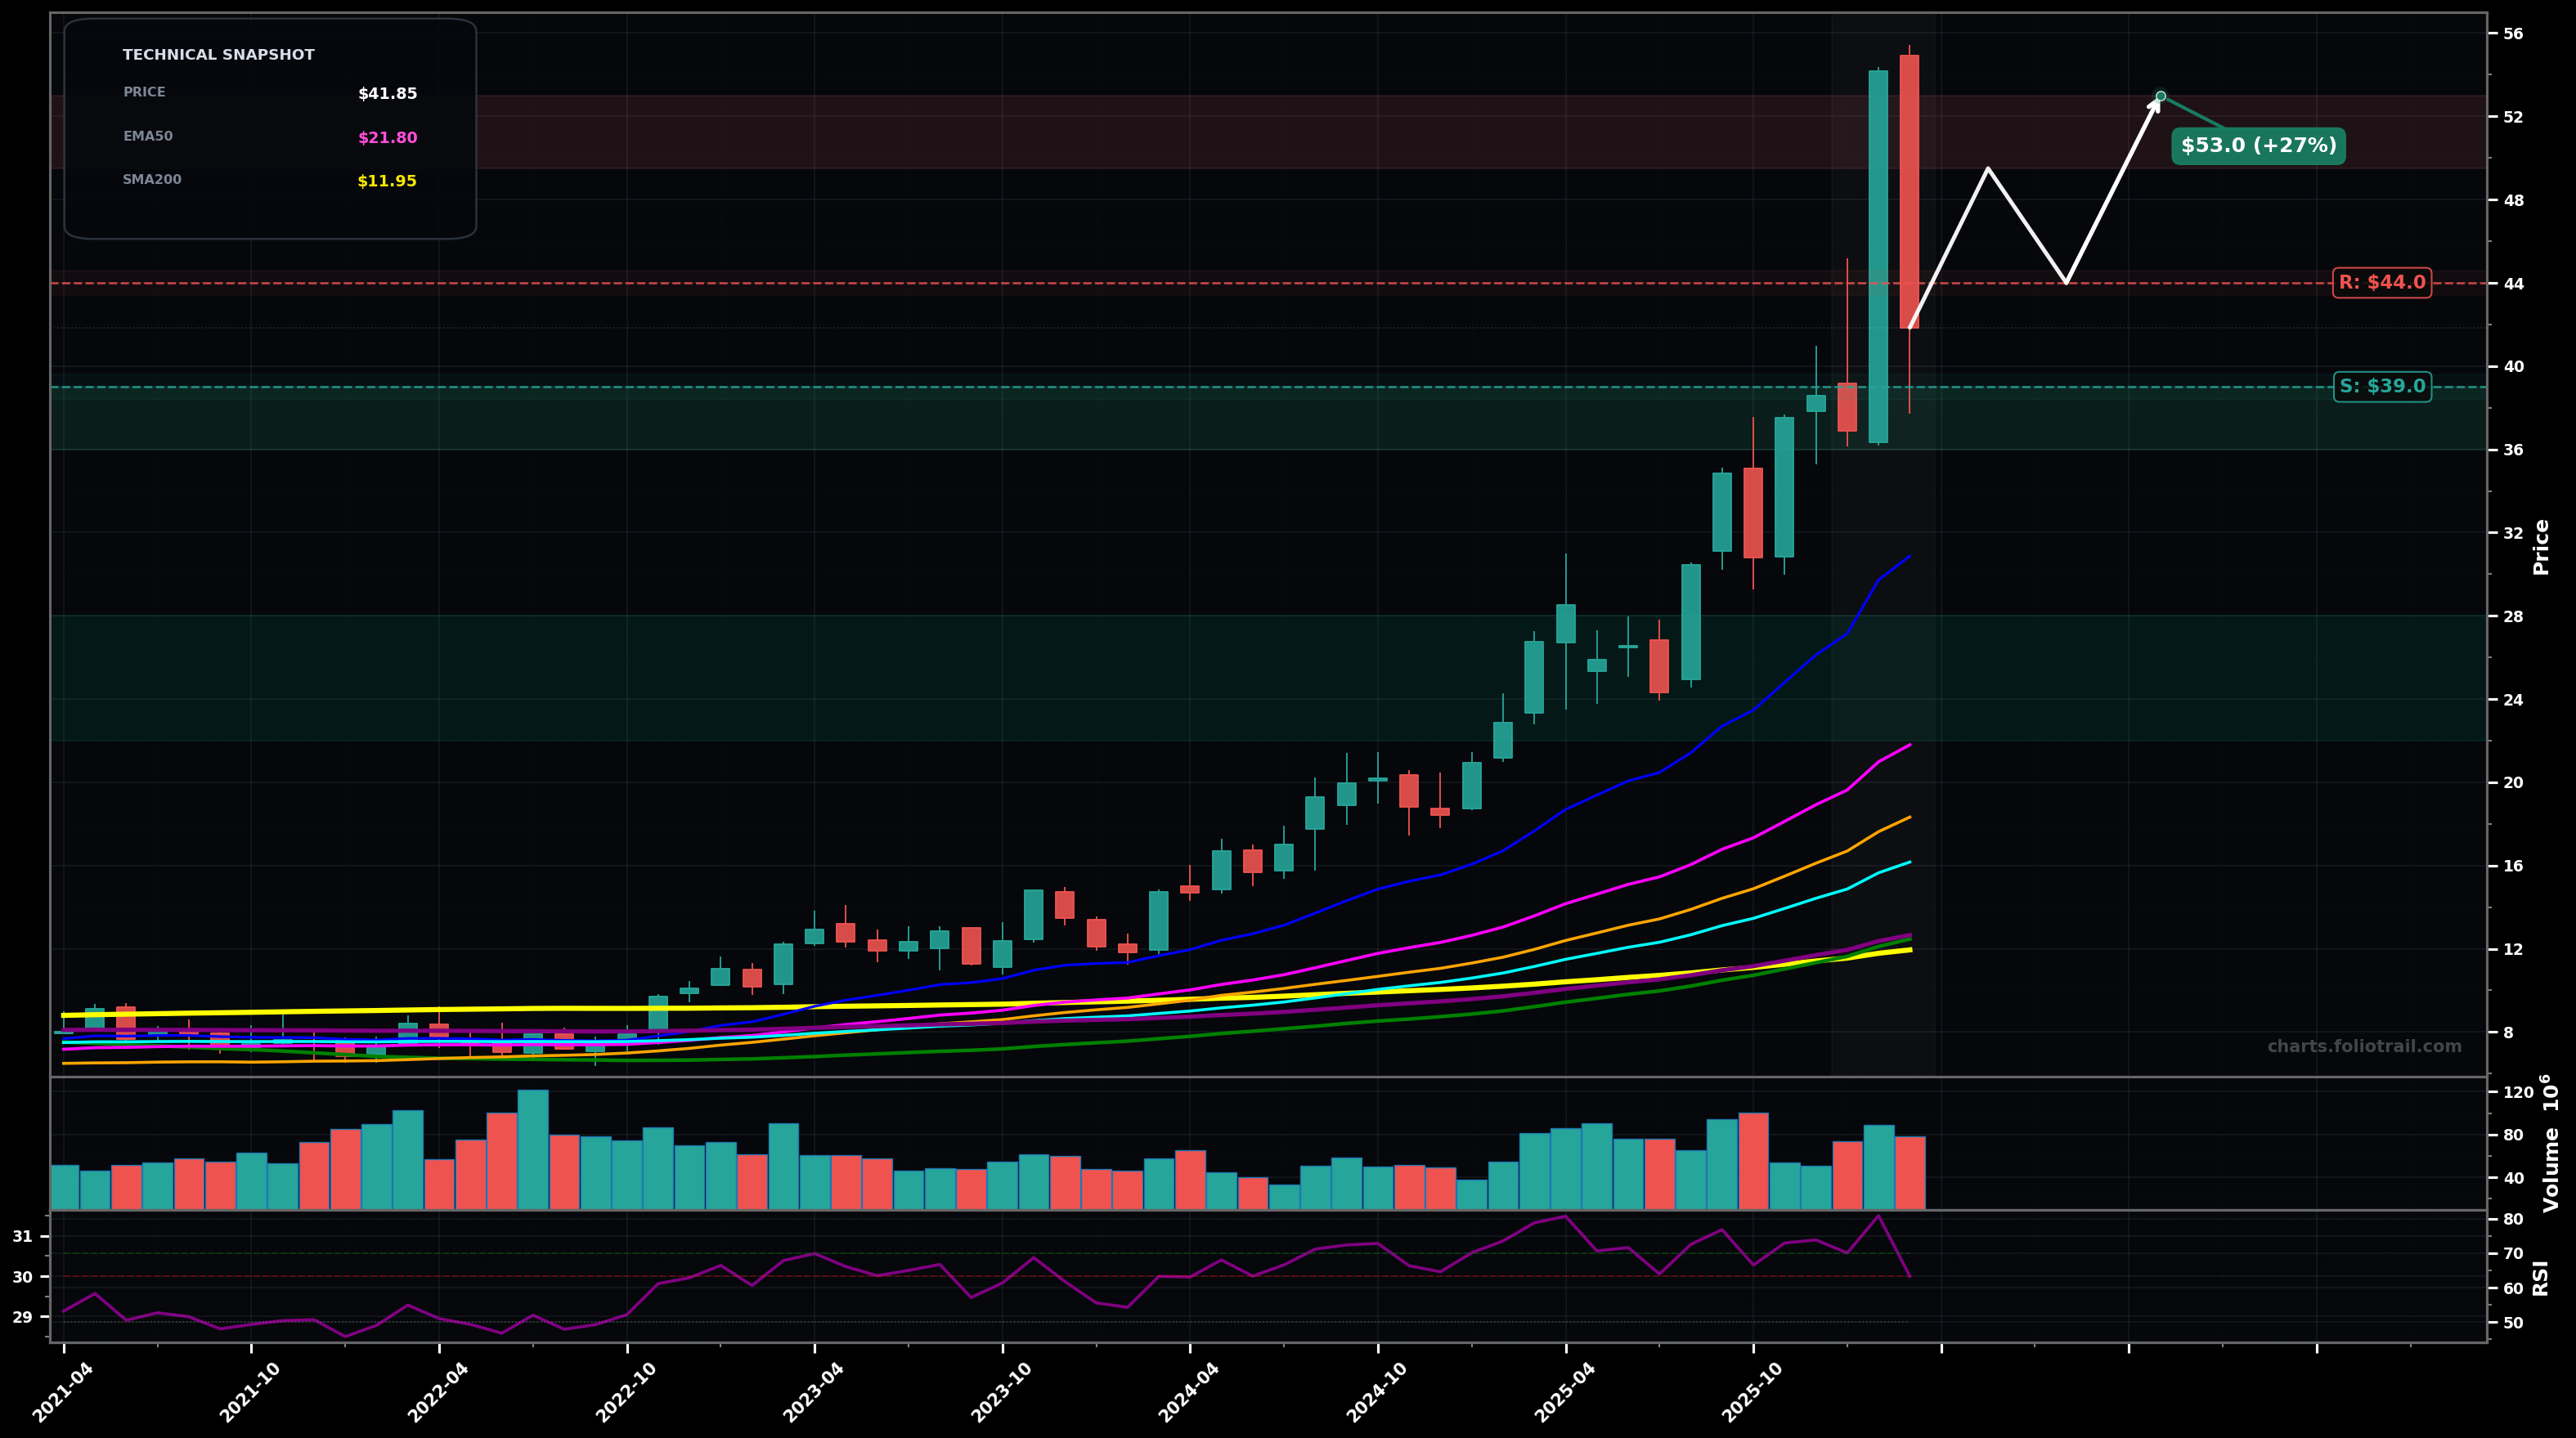
As of March 26, 2026, AGI (Alamos Gold Inc.) is in a volatility expansion state on the monthly chart, with a confidence level of 72%. Key support is at $39.0 and key resistance at $44.0. Monthly uptrend made a sharp spike to new highs (~$53) then printed a large red pullback candle, closing back near ~$41.85 (volatility expansion after a blow-off move).
Bullish consolidation: price bases between ~$39–$44, then resumes trend and retests the prior high area; this fits a Wave 4-style pullback after an extended Wave 3/5 burst, with buyers defending prior breakout levels.
Bearish mean-reversion: the spike is a blow-off top; price breaks $39 support and mean-reverts toward the fast trend MAs, seeking EMA20 (~$30.88) / prior structure before finding demand (deeper Wave 4/A leg).
2 monthly closes holding above $39.00 while reclaiming $44.00 would confirm volatility resolving higher
Monthly close below $35.00 would shift odds to a deeper correction/failed spike
Start near the post-spike support ($39) for trend-continuation; add on breakdown/mean-reversion toward EMA20 (~$31); heavy add only if a deeper monthly reset pulls toward EMA50 ($21.8) / prior multi-MA cluster.
Trim into prior high retest ($53) and extensions; heavier trims on a clear new impulse extension beyond the blow-off zone; full exit only on extreme multi-year stretch (large gap above EMA50/100 with euphoric candles).
As of March 26, 2026, AGI (Alamos Gold Inc.) is in a volatility expansion state on the monthly chart with 72% confidence. Monthly uptrend made a sharp spike to new highs (~$53) then printed a large red pullback candle, closing back near ~$41.85 (volatility expansion after a blow-off move).
On the monthly timeframe, AGI has key support at $39.0 and key resistance at $44.0. The most likely scenario (bullish) targets $49.5 and $53.0, with a revert level at $44.0.
AGI (Alamos Gold Inc.) is currently classified as volatility expansion on the monthly chart, with 72% confidence. Confirmation requires: 2 monthly closes holding above $39.00 while reclaiming $44.00 would confirm volatility resolving higher This would be invalidated by: Monthly close below $35.00 would shift odds to a deeper correction/failed spike
The most likely scenario (bullish) targets $49.5 and $53.0, with a revert level at $44.0. The alternative scenario (bearish) targets $35.0 and $31.0.
Multi-layer AI agents analyse 200+ stocks across daily, weekly, and monthly timeframes — producing market state classifications, price scenarios with targets, and position entry/exit levels. Updated every trading day after market close. No paywall. No sign-up required.
Built by Foliotrail.
All content on this website — including charts, analysis, price targets, support/resistance levels, and position zones — is generated entirely by AI and provided for educational and informational purposes only.
This is not financial advice. NEXUSNOIR VENTURES SL (the operator of this website) is not a registered investment adviser or broker-dealer. You should not make investment decisions based solely on this information. Always do your own research and consult a qualified financial advisor.
By continuing, you acknowledge that you have read and agree to our full disclaimer & terms of use and privacy policy.