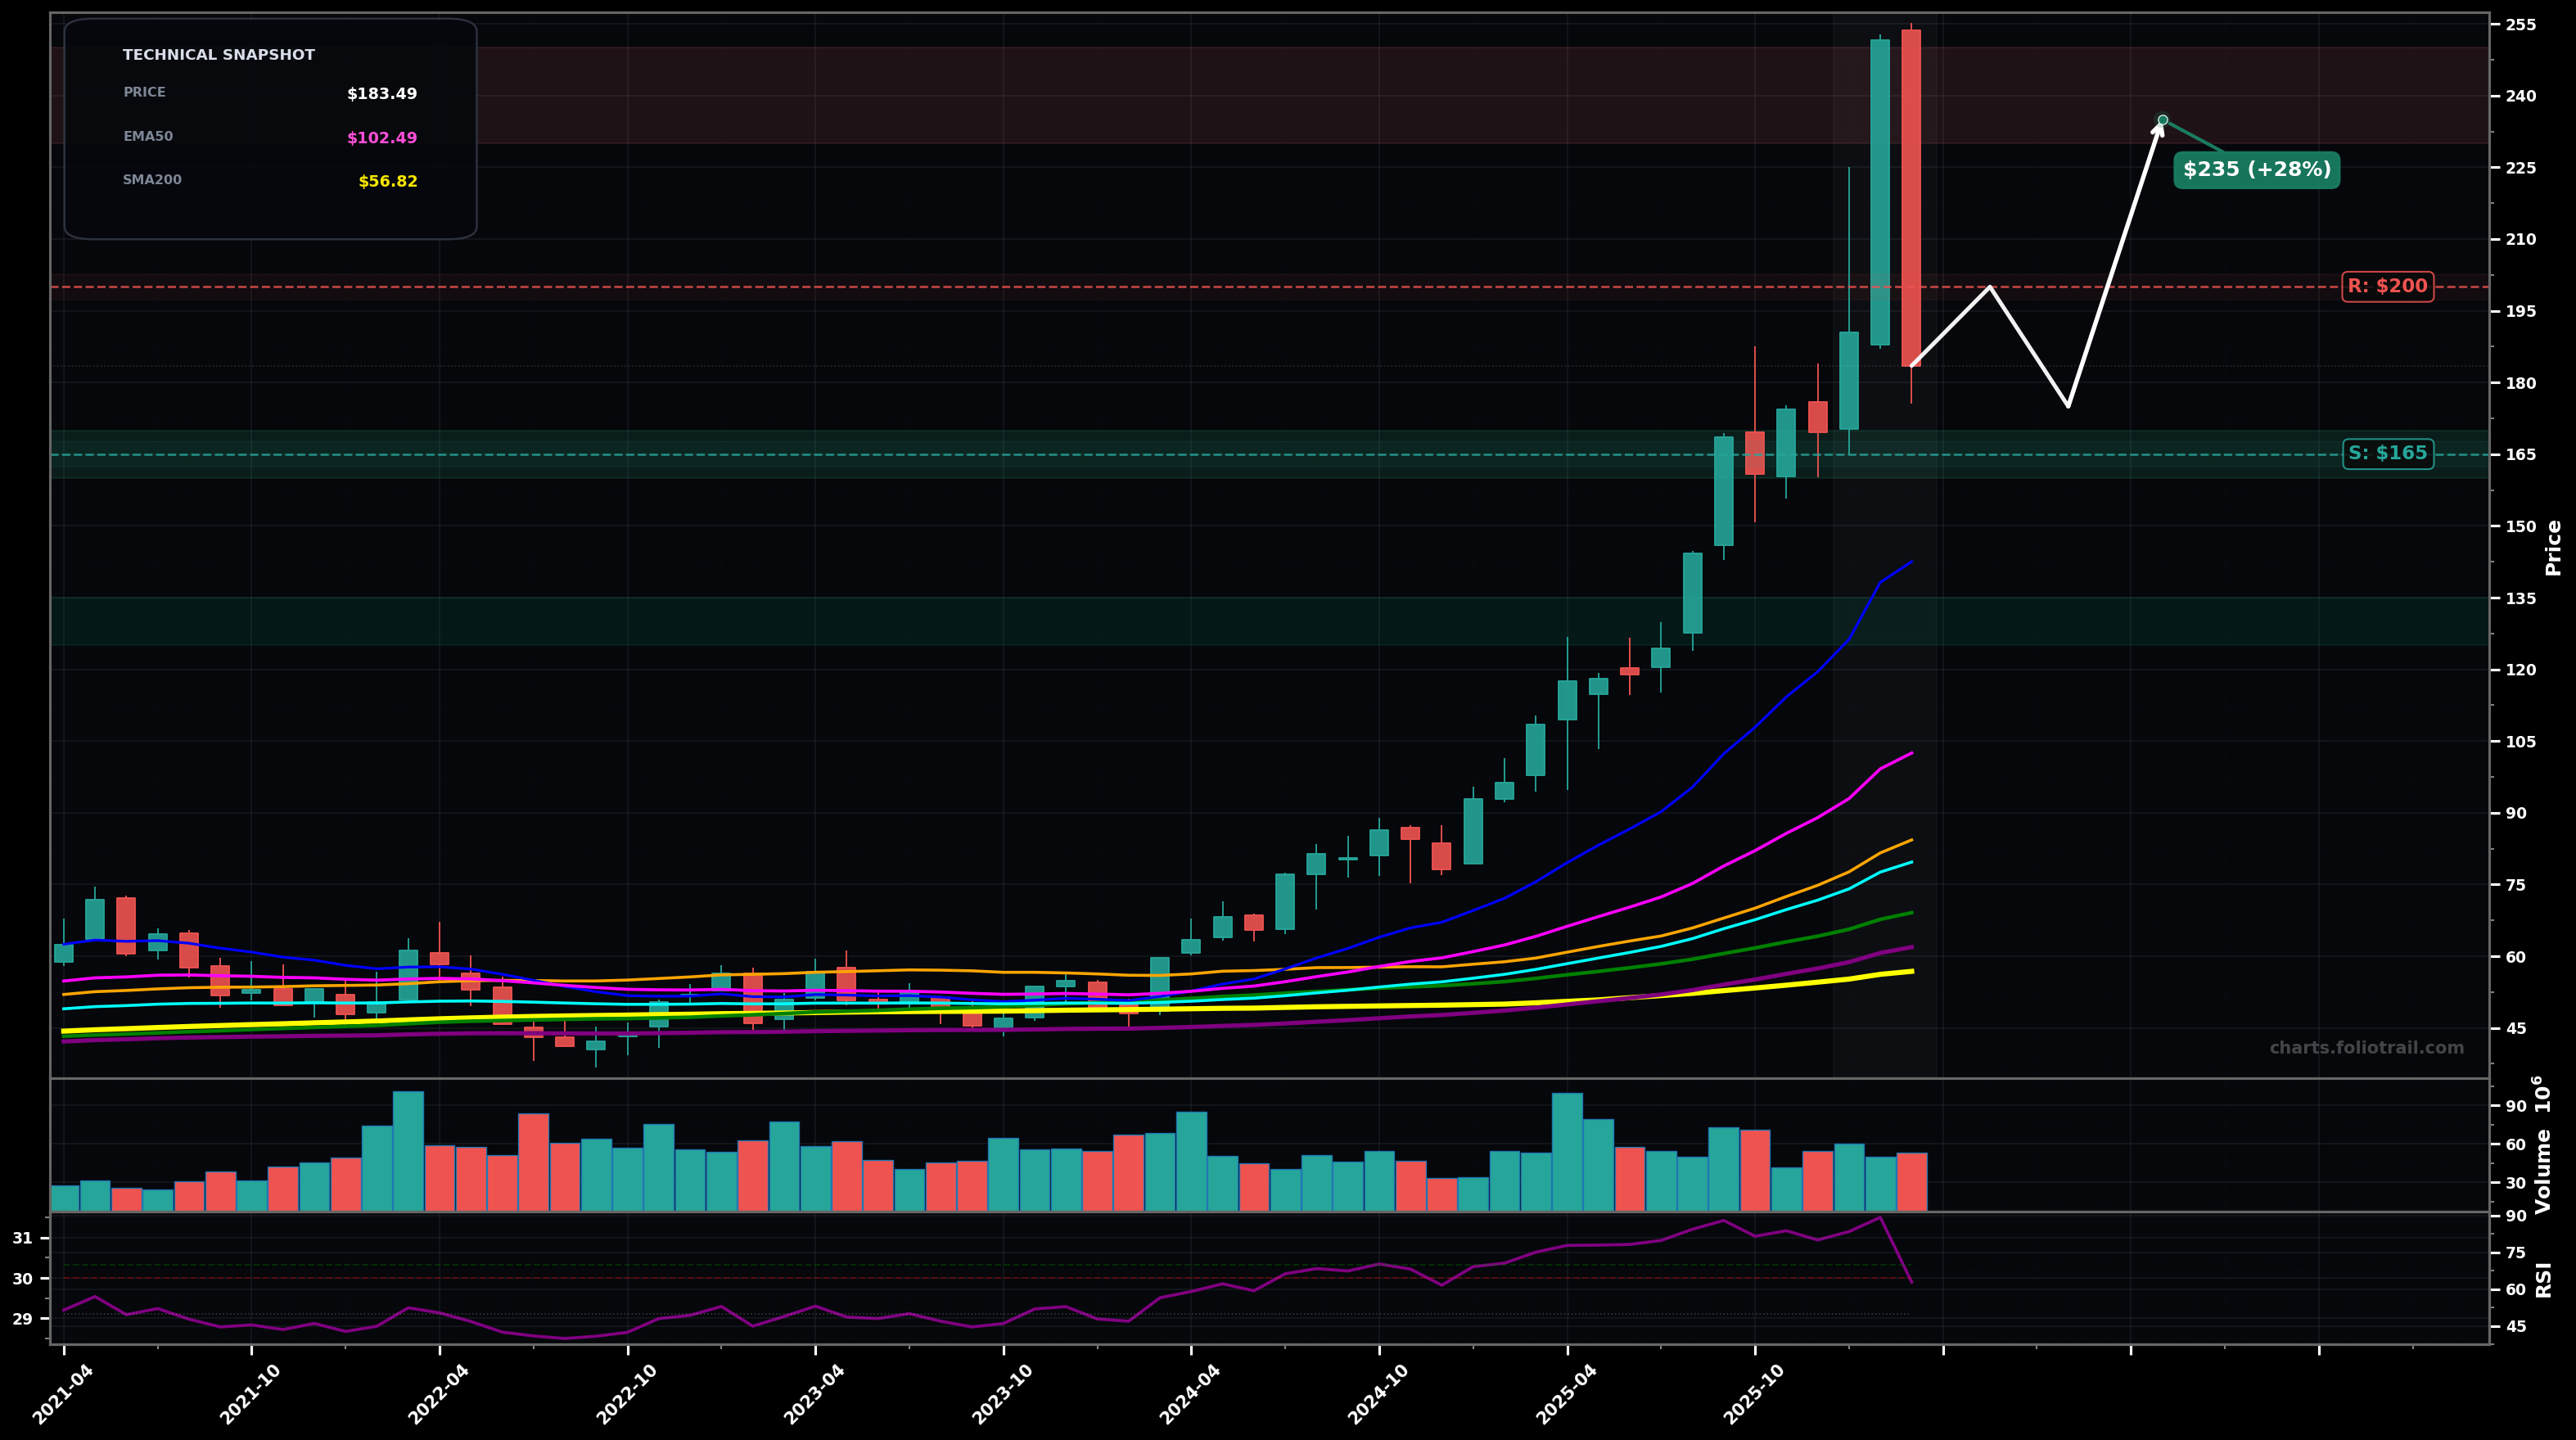
As of March 25, 2026, AEM (Agnico Eagle Mines Limited) is in a parabolic state on the monthly chart, with a confidence level of 72%. Key support is at $165 and key resistance at $200. Strong multi-month HH/HL advance with a volatility spike to ~$250s followed by a sharp pullback to ~$183; still well above rising EMAs/SMAs.
Bullish continuation after a digestion: price holds ~$165–$170, builds a higher low, then reclaims ~$200; next leg targets the prior spike zone (Elliott: likely Wave 4 consolidation before Wave 5 attempt).
Deeper mean reversion: failure to reclaim ~$200 leads to another leg down toward the mid-$150s where trend support/previous breakout area sits; could be a larger Wave 4 retrace (Fibo 38.2%–50% zone of the latest impulse).
Monthly close back above ~$200 with follow-through toward ~$225+
Monthly close below ~$165 (break of the most recent impulse support area and momentum regime shift)
Start/add/heavy-add are aligned with probable Wave-4 mean-reversion zones and prior breakout/structure supports, while keeping room for volatility after a parabolic spike.
Trim into retests/expansions near the prior blow-off highs and extension zones where parabolic moves often fade; full exit reserved for extreme multi-year stretch/extension.
As of March 25, 2026, AEM (Agnico Eagle Mines Limited) is in a parabolic state on the monthly chart with 72% confidence. Strong multi-month HH/HL advance with a volatility spike to ~$250s followed by a sharp pullback to ~$183; still well above rising EMAs/SMAs.
On the monthly timeframe, AEM has key support at $165 and key resistance at $200. The most likely scenario (bullish) targets $200 and $235, with a revert level at $175.
AEM (Agnico Eagle Mines Limited) is currently classified as parabolic on the monthly chart, with 72% confidence. Confirmation requires: Monthly close back above ~$200 with follow-through toward ~$225+ This would be invalidated by: Monthly close below ~$165 (break of the most recent impulse support area and momentum regime shift)
The most likely scenario (bullish) targets $200 and $235, with a revert level at $175. The alternative scenario (bearish) targets $155 and $130.
Multi-layer AI agents analyse 200+ stocks across daily, weekly, and monthly timeframes — producing market state classifications, price scenarios with targets, and position entry/exit levels. Updated every trading day after market close. No paywall. No sign-up required.
Built by Foliotrail.
All content on this website — including charts, analysis, price targets, support/resistance levels, and position zones — is generated entirely by AI and provided for educational and informational purposes only.
This is not financial advice. NEXUSNOIR VENTURES SL (the operator of this website) is not a registered investment adviser or broker-dealer. You should not make investment decisions based solely on this information. Always do your own research and consult a qualified financial advisor.
By continuing, you acknowledge that you have read and agree to our full disclaimer & terms of use and privacy policy.